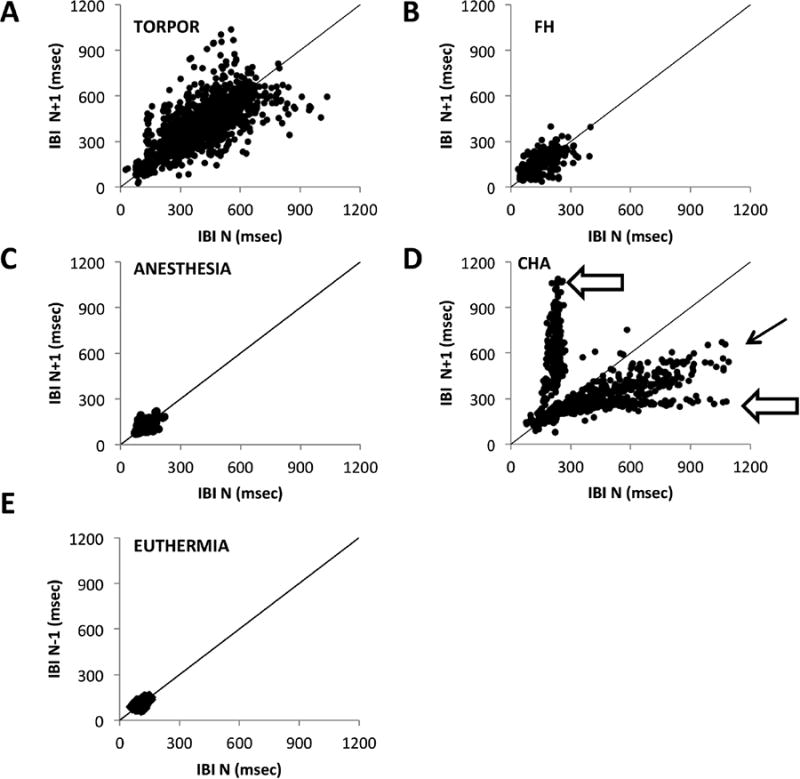
Figure 5. Long HR pauses are only present in torpor and CHA-induced hypothermia.

Poincare plots represent the variability in the interbeat intervals (IBI) by plotting adjacent IBIs against each other. A symmetry line is added as a reference. A. Torpor shows a symmetric pattern indicative of skipped beats. B. FH-treated mice and C. Isoflurane-anesthesia treated mice cluster near the symmetry line, indicating a relatively regular heartbeat. D. CHA shows asymmetries (black arrow) that are indicative of pauses that are not skipped beats. The open arrows point to the long pauses seen in the CHA condition. E. The IBIs of a euthermic mouse cluster tightly around the symmetry line (6 hours of data are shown).
