
Figure 3. Rspo2+ and Ppp1r1b+ BLA neurons are activated by valence-specific stimuli.
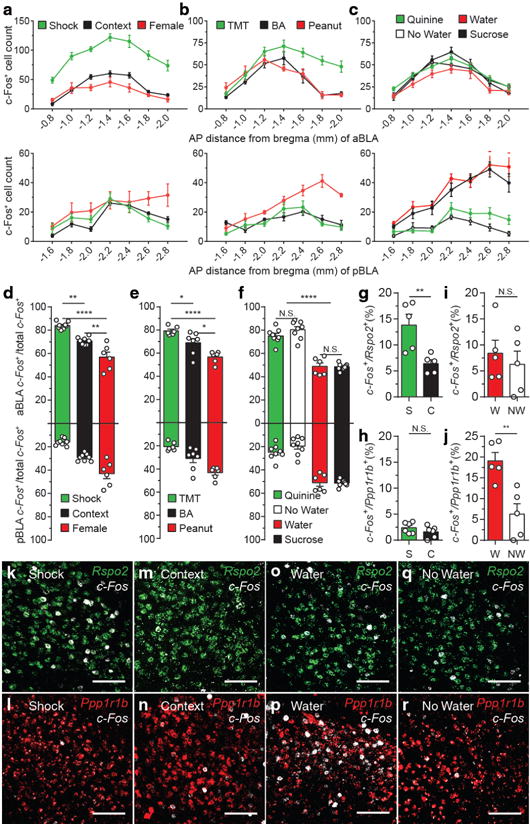
c-Fos expression across the AP axis (coronal distance from bregma −0.8mm to −2.8mm) of the aBLA (top) and pBLA (bottom) in response to shock (n = 8), context (n = 8), female (n = 6) (a); TMT (n = 6), BA (n = 7), peanut oil (n = 6) (b); quinine water (n = 8), no water (n = 8), water (n = 6), sucrose water (n = 8) (c). The total number of c-Fos+ cells is represented for each coronal section of a unilateral BLA (a–c), micrographs found in Supplemental Fig. 4. d, Relative c-Fos expression in the aBLA and pBLA in response to shock, context, female (one-way ANOVA, F2,19=33.91, P<0.0001). e, Relative c-Fos expression in response to TMT, BA, peanut oil (one-way ANOVA, F2,16=16.61, P=0.0001,). f, Relative c-Fos expression in response to quinine water, no water, water, sucrose water (one-way ANOVA, F2,19=33.91, P<.0001). Significance for multiple comparisons (d–f), *P < 0.05, **P < 0.01, ****P < 0.0001, not significant (N.S.). Double-label smFISH (n = 5 in each group) of c-Fos/Rspo2+ (g,k,m) or c-Fos/Ppp1r1b+ (h,l,n) in response to shock (S) or context (C). Double-label smFISH of c-Fos/Rspo2+ (i,o,q) or c-Fos/Ppp1r1b+ (j,p,r) in response to water (W) or no water (NW) (AP axis analysis in Supplemental Fig. 5), y-axis values denote percentage. Significance for unpaired t-test (g–j), **P<0.01, not significant (N.S). Scale bar 125μm (k–r). Results show mean ± s.e.m (a–j). Color scheme corresponds to the valence of the stimuli negative (green) and positive (red) (a–j), Rpso2(green) and Ppp1r1b(red) (k–r).