
Figure 7. Rspo2+ and Ppp1r1b+ BLA neurons project to distinct amygdaloid nuclei and prefrontal areas.
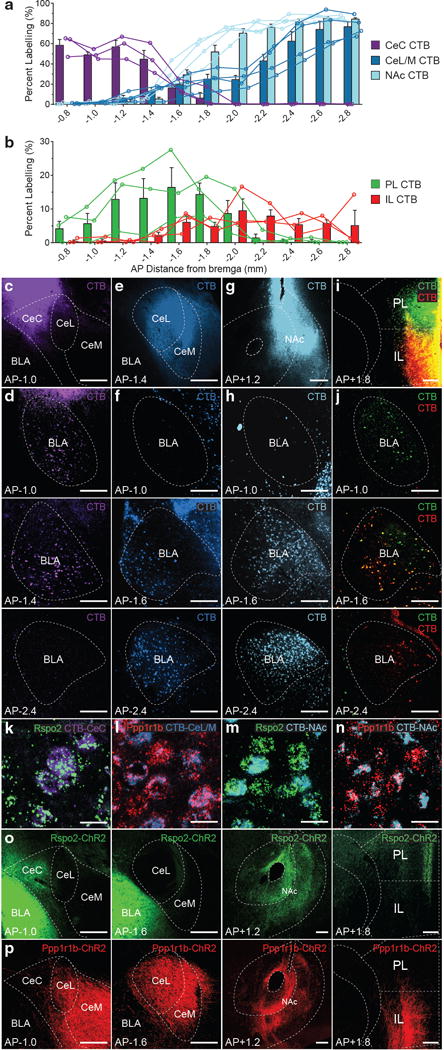
Quantification of CTB+ neurons across the AP axis (coronal distance from bregma −0.8mm to −2.8mm) of the BLA from CTB targeted to the amygdala and supplemental amygdala areas (a)—CeC (c,d), CeL/CeM (e,f), NAc (g,h), or dual CTB targeted to prefrontal cortex (b)—PL and IL (i,j) (bar represent mean, lines represent individual mice, n = 3 mice per group). Injections site of CTB (c,e,g,i) and CTB+ BLA neurons (d,f,h,j). Co-labelling of Rspo2 mRNA in the BLA with CTB targeted to the CeC (k) and NAc (m). Co-labelling of Ppp1r1b mRNA in the BLA with CTB injected into the CeL/CeM (l) and NAc (n), quantification in Table 1, micrographs in Supplemental Fig.7. Rspo2-ChR2+ fibers are found in the CeC, NAc, and PL (o). Ppp1r1b-ChR2+ fibers are found in the CeL, CeM, NAc, and IL (p). Scale bar 250 μm (c-j,o,p), 25 μm(k–n). Results show mean ± s.e.m. Color scheme corresponds to the virus-infected transgenic mouse, Rpso2-Cre (green) and Cartpt-Cre (red) (o,p).