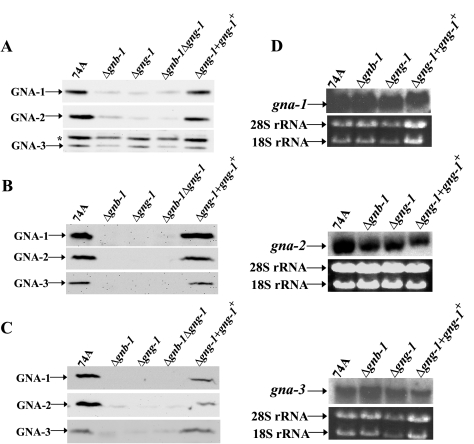
FIG. 5.
Analysis of Gα protein and transcript levels. The strains used in the analysis were 74A (wild type), Δgng-1 (5-5-12), Δgnb-1 (42-8-3), Δgnb-1 Δgng-1 5-4, and Δgng-1 + gng-1+ 113-1. (A) Gα protein levels in 16-h submerged cultures. Samples containing 30 μg of protein from plasma membrane fractions were subjected to Western analysis using specific antisera (see Materials and Methods). The asterisk indicates a nonspecific band. (B) Gα protein levels in VM plate cultures. Protein samples were as indicated in panel A. (C) Gα protein levels in SCM plate cultures. Protein samples were as indicated in panel A. (D) Analysis of gna-1, gna-2, and gna-3 transcript levels. Total RNA was extracted from 16-h submerged cultures, and 20 μg was subjected to Northern analysis using a 5.6-kb EcoRI-ClaI genomic fragment from pPNO5, a 967-bp gna-2 PCR product amplified from plasmid 13M2A5-2, or a 1,068-bp gna-3 PCR product amplified from pAK1 as probes. The amounts of the two major rRNA species are indicated as a loading control.

