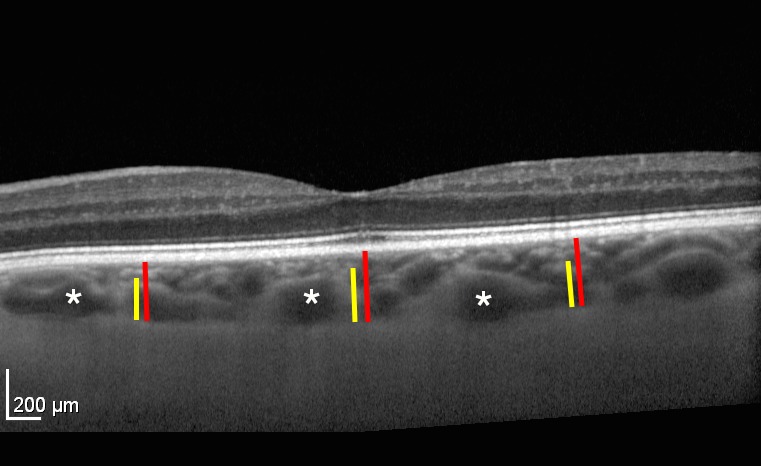
Figure 3.

Choroidal vasculature measurements. The vertical red bars delineate the CT from the RPE to the choroidal–scleral interface. The temporal and nasal measurements are located 750 μm from the subfoveal CT measurement. The yellow bars delineate the large choroidal vessel layer. In this measurement, any vessel larger than 100 μm was considered part of the LCVL. The MCVL/choriocapillaris layer is the difference between the red and yellow lines. Asterisks are several examples of large choroidal vessels.
