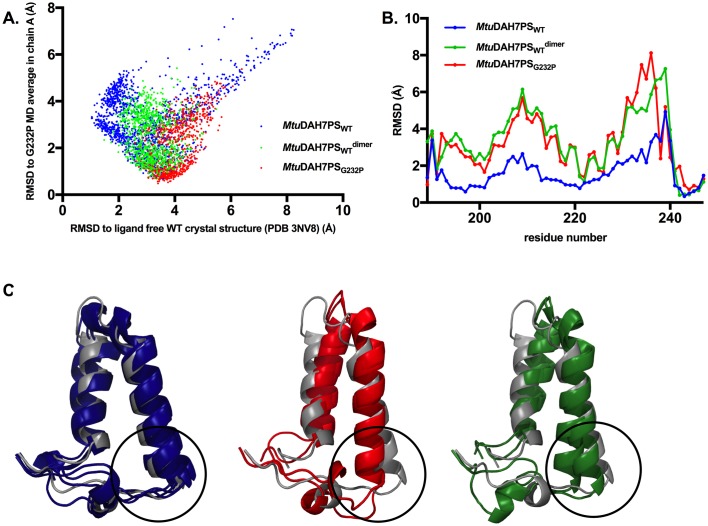
Fig 7. Analysis of conformational ensembles from MD simulations.
(A) MD conformational ensemble sampled by loop 2 (residues 130 to 153) during equilibrated time period of MD simulations for tetrameric MtuDAH7PSWT (blue), dimeric variant MtuDAH7PSG232P (red) and the theoretical dimer MtuDAH7PSWTdimer (green). RMSD values of Cα atoms on loop 2 residues (130 to 153) were measured in reference to both the MD average of MtuDAH7PSG232P variant and crystal structure of ligand free MtuDAH7PSWT. (B) Chain-averaged α-carbon RMSD values of MD average conformations of MtuDAH7PSWT, MtuDAH7PSwtdimer, and MtuDAH7PSG232P in comparison with crystal structure of ligand free MtuDAH7PS (PDB 3NV8), for residue range 189–247. (C) Superimposition between ligand free crystal structure of MtuDAH7PS (PDB 3NV8, grey) and MD average conformations of each chain from MD simulations of MtuDH7PSWT (blue), MtuDAH7PSG232P (red) and MtuDAH7PSWTdimer (green), only residues 190–243 are displayed for clarity. Regions that are responsible for forming the tetramer interface are highlighted in black circles.

