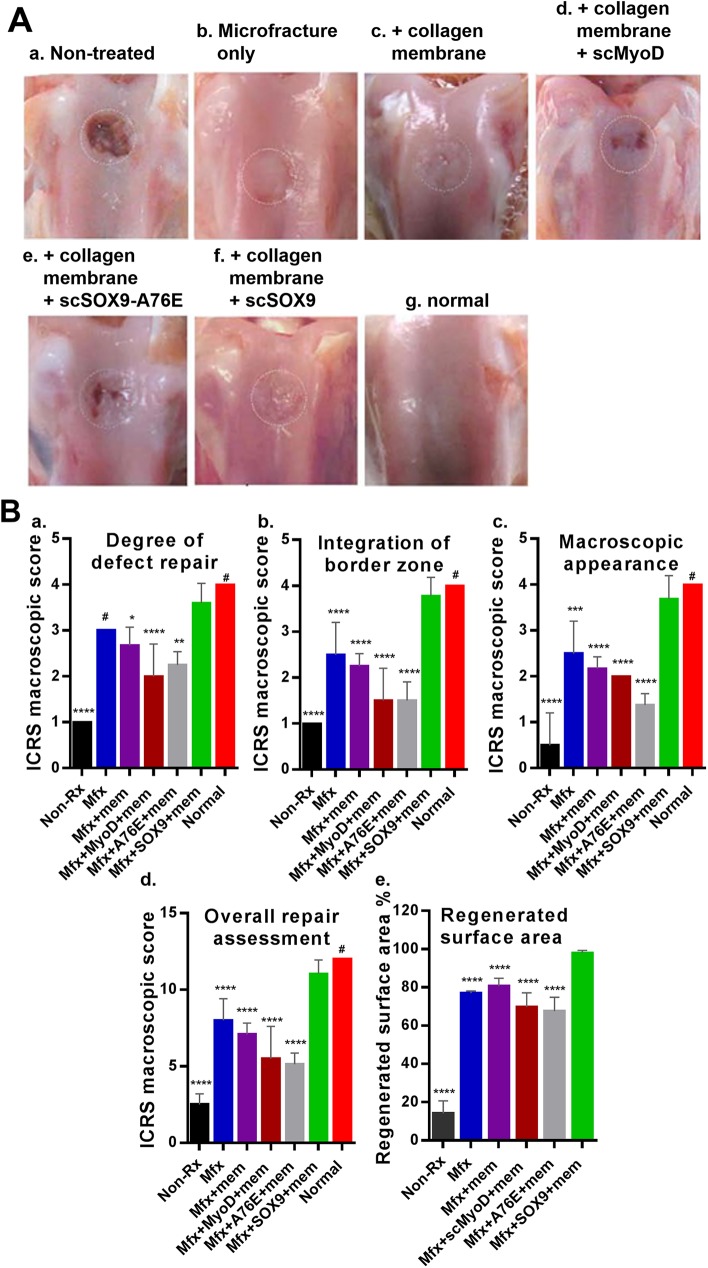
Fig 3. Macroscopic assessment of cartilage repair.
(A) Photographs of rabbit knee articular osteochondral defects 8 weeks after treatments, the joints were examined grossly. The dotted circles indicate the original defect margin. Normal cartilage surface of the distal femur was used as reference (g). (B) Macroscopic assessment of cartilage repair was quantified by International Cartilage Repair Society (ICRS) macroscopic evaluation scale (S1 Table) [27]. Non-Rx: Non-treated; Mfx: microfracture only; Mfx + mem: microfracture and collagen membrane; Mfx+MyoD+mem: microfracture and collagen membrane containing myogenic differentiation factor (MyoD); Mfx+A76E+mem: microfracture and collagen membrane containing mutant form of super-charged SRY-type high-mobility group box-9 (scSOX9-A76E); Mfx+SOX9+mem: microfracture and collagen membrane containing scSOX9; Normal: normal cartilage. Results were presented as the mean ± SD; statistical analysis was performed to compare scores of each of other treatment groups and normal cartilage to that of Mfx+SOX9+mem group respectively; n = 4–11 in each group; *p < 0.05; ** p < 0.01; *** p < 0.001; **** p < 0.0001; # Not significant.

