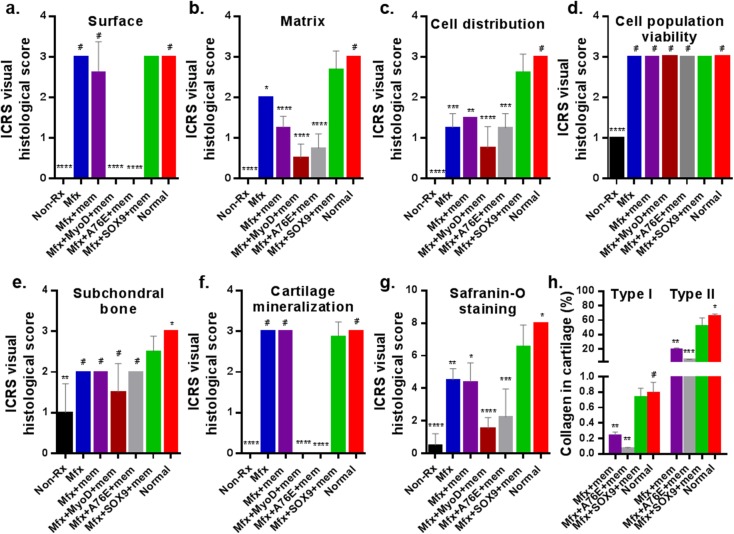
Fig 5. International Cartilage Repair Society (ICRS) scores and the percentage of regenerated tissue.
H&E staining sections were scored according to ICRS assessment system (S2 Table) and updated recommendations [28, 29]. Each of the categories of assessment (a, b, c, d, e and f) was reported separately as recommended by ICRS [28]. g: Quantification of Safranin O staining was assessed as described previously [30]. h: Collagen type I and type II of the reparative cartilage tissue were quantified by ELISA and expressed as percentage of dry weight of cartilage. *p < 0.05; **p < 0.01; *** p < 0.001; ****p < 0.0001; # Not significant. (Results were presented as the mean ± SD; n = 4–11 in each group). Non-Rx: Non-treated; Mfx: microfracture only; Mfx + mem: microfracture and collagen membrane; Mfx + MyoD+mem: microfracture and collagen membrane containing myogenic differentiation factor (MyoD); Mfx+A76E+mem: microfracture and collagen membrane containing mutant form of super-charged SRY-type high-mobility group box-9 (scSOX9-A76E); Mfx+SOX9+mem: microfracture and collagen membrane containing scSOX9; Normal: normal cartilage. Results were presented as the mean ± SD; statistical analysis was performed to compare scores of each of other treatment groups and normal cartilage to that of Mfx+SOX9+mem group respectively; n = 4–11 in each group; *p < 0.05; ** p < 0.01; *** p < 0.001; **** p < 0.0001; # Not significant.

