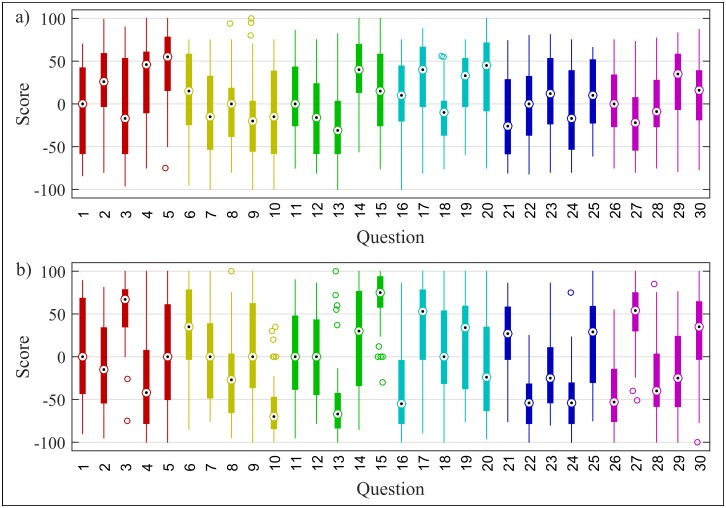
Fig 2. (a) and (b) reflect response scores for each question for current and desirable (future) state respectively.
Color coding reflects the theme of the question. Central mark in each box plot, with top and bottom box edges, correspond to the median, the 25th and the 75th percentile respectively. Markers outside the box correspond to outliers.

