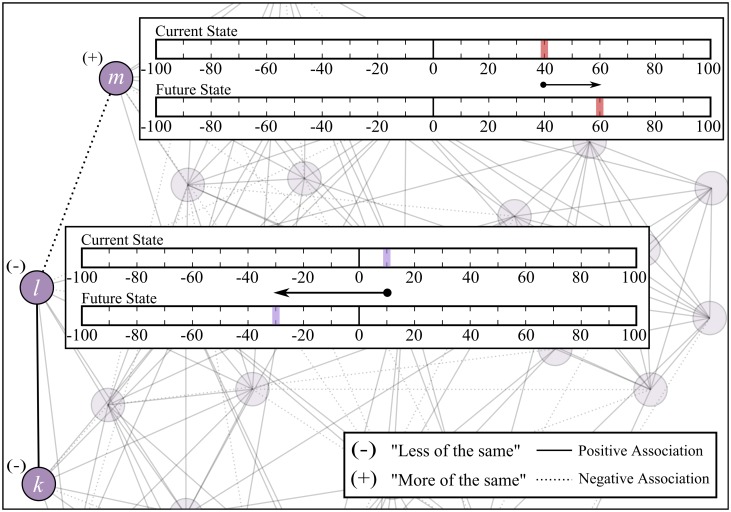
Fig 3. Belief network for a given individual, where each node corresponds to a belief and links corresponds to belief associations.
Boxes corresponds to typical survey scores, with upper box leading to belief m being allocated a “+” (“more of the same”) while belief l is allocated a “-” (“less of the same”). Consequently, an association between similarly signed beliefs (e.g. belief k and l) is considered as positive (solid line), with opposite signs (e.g. belief l and m) resulting to a negative associations (dotted line).

