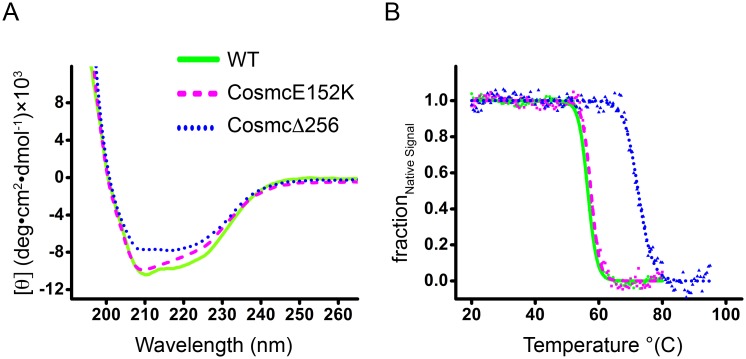
Fig 3. CD spectra and thermal denaturation curves.
WT Cosmc (solid line, green), CosmcE152K (dashed line, magenta), and CosmcΔ256 (dotted line, blue) are plotted together for comparison. (A) The far UV CD spectra of Cosmc and mutants are indicative of well-folded proteins with significant helical content. (B) Thermal denaturation was followed by recording the CD signal at 222 nm with a slope of 1°C/min. Data are presented as fraction of the native signal (Ffold) as a function of temperature.

