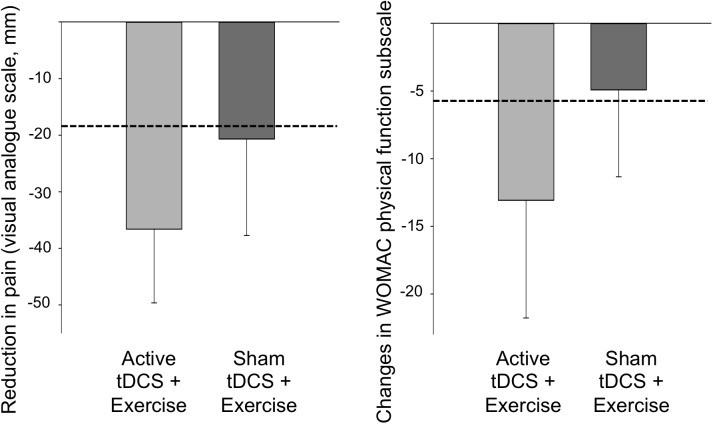
Fig 4. Group change in pain (left panel) and WOMAC physical function subscale (right panel).
The graph showed within-group changes (mean and 95% confidence interval) in pain and function following 8 weeks of either active tDCS + exercise or sham tDCS + exercise. Note: larger negative scores indicate greater improvements in pain and function. The dotted line indicates the minimal clinically important change for each outcome.

