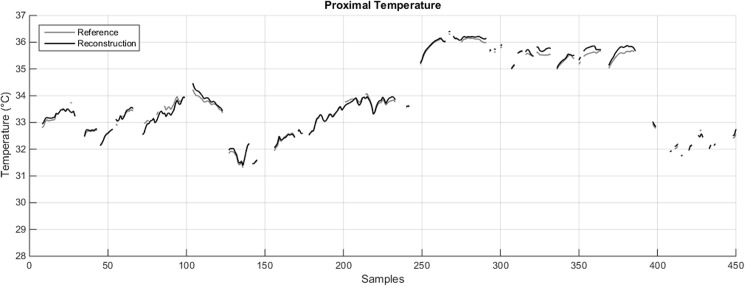
Fig 2. Comparison between the reference TPROX (grey line) and its reconstruction (black line) obtained in one subject with three sensors (A, RIA, RMT) worn for 22.5 hours, weighed by the appropriate coefficients provided in Table 1.
The gaps in the plot are the result of the pre-processing procedure described in S1 File.

