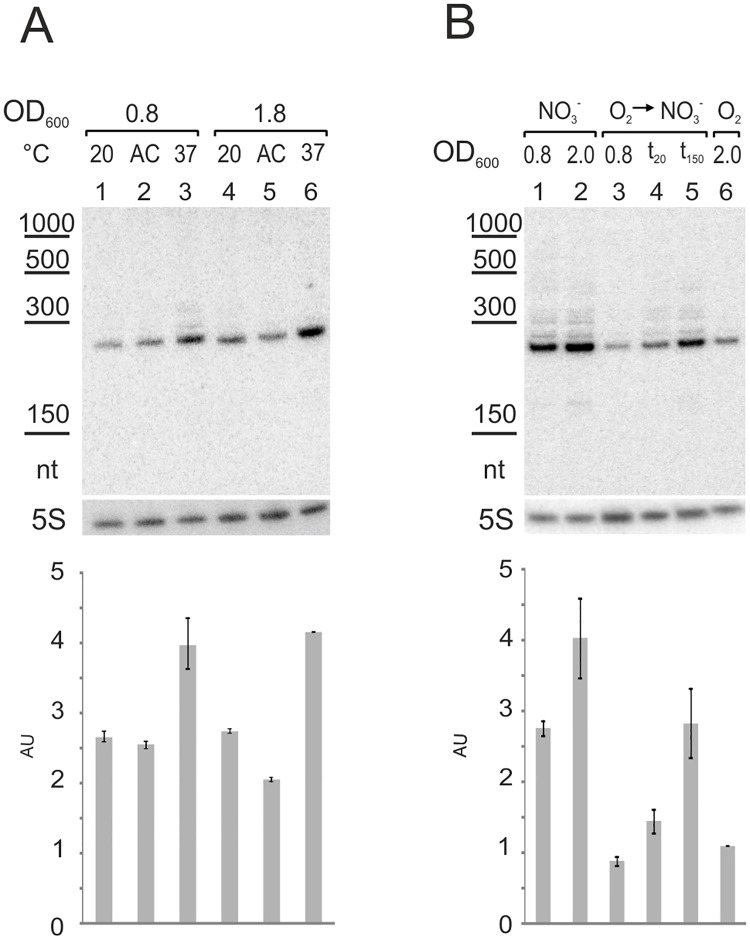
Fig 3. PesA expression is induced by temperature and low availability of oxygen.
Levels of PesA RNA in: A) Wild-type PA14 grown in BHI at 20°C (lanes 1 and 4), 37°C (lanes 3 and 6) or following 20 min of acclimation (AC) from 20 to 37°C (lanes 2 and 5). Culture samples were taken at middle (OD600 of 0.8) and late (OD600 of 1.8) exponential growth phase. B) Wild-type PA14 grown in BHI anaerobically (NO3−; lanes 1 and 2), aerobically (O2, lane 6) and aerobically until an OD600 of 0.8 and then shifted to anaerobic conditions (O2 → NO3−; lanes 3, 4 and 5). Samples were taken 20 and 150 min after the shift to anaerobic conditions (t20 and t150). After sampling, cell cultures were processed for total RNA extraction and analysis by Northern blot. Intensities of the bands of PesA were quantified and normalized to those of 5S RNA in the same lane. Values are expressed as arbitrary units (AU) in the histograms below each Northern blot and represent the mean ± Standard Deviation (SD) of three independent experiments.

