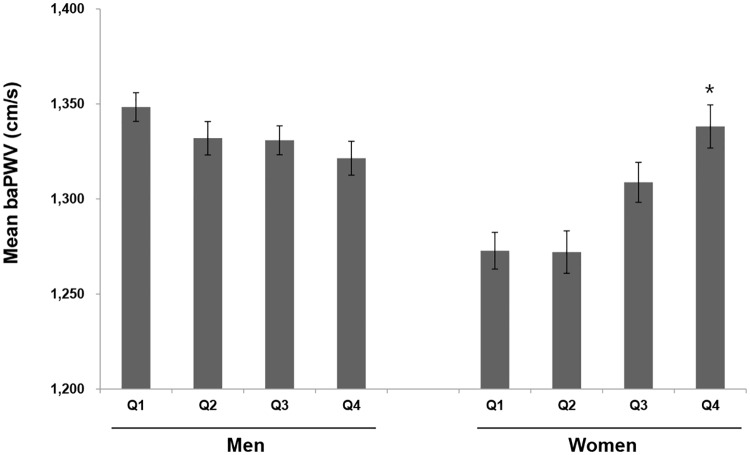
Fig 2. Sex-based differences in baPWV by serum uric acid level.
Comparison of baPWV among subjects with serum uric acid quartiles by sex, based on ANCOVA with adjustment for age, smoking, SBP, BMI, fasting glucose, HDL-cholesterol, and LDL-cholesterol. The SUA levels were divided into sex-specific quartiles as follows: in men, Q1: 113.1–309.4, Q2: 309.41–351.1, Q3: 351.11–398.7, and Q4: 398.71–719.9 μmol/L; in women, Q1: 119.0–226.1, Q2: 226.1–255.9, Q3: 255.91–291.6, and Q4: 291.61–517.7 μmol/L. *p < 0.05 compared with Q1 of SUA.

