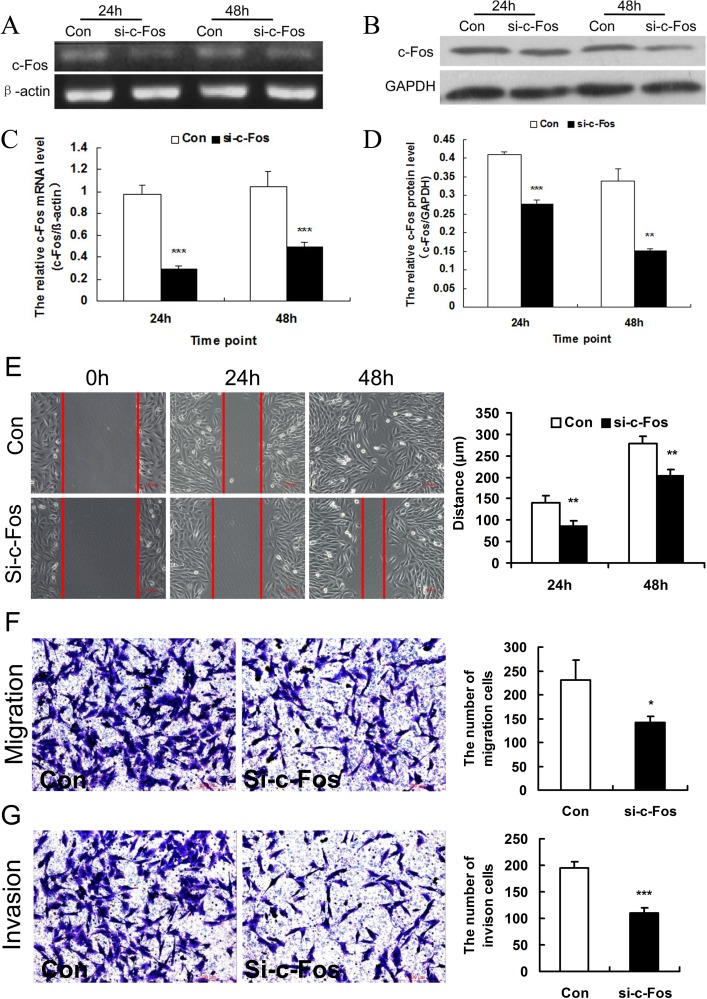
Fig 2. Knockdown of c-Fos inhibited cell migration and invasion of MG63 cells in vitro.
A. Expression of c-Fos in MG63 cells was examined by RT-PCR at 24 and 48 h after transfection with c-Fos siRNA (si-c-Fos) or the negative control (Con). β-actin served as an internal control. B. Expression of c-Fos was examined by Western blot at 24 and 48 h after transfection with c-Fos siRNA (si-c-Fos) or the negative control (Con). GAPDH served as an internal control. C. Data represented means ± SD for four independent experiments of RT-PCR analysis of c-Fos. D. Data represented means ± SD for four independent experiments of Western blot analysis of c-Fos. E. Wound healing assay for determining the migration of MG63 cells transfected with c-Fos siRNA (si-c-Fos) or negative control (Con), bar = 100 μm; Data of the distance of cell migration were from three independent experiments. F. Images showing that the migrated cells treated with c-Fos siRNA (si-c-Fos) were significantly decreased compared with the control groups, bar = 200 μm. Data of the average number of cells was from three independent experiments. G. Images showing that the invasive cells treated with c-Fos siRNA (si-c-Fos) were significantly decreased compared with the control groups, bar = 200 μm. Data of the average number of cells were from three independent experiments. *p < 0.05, **p < 0.01, ***p < 0.001 versus negative control (Con).

