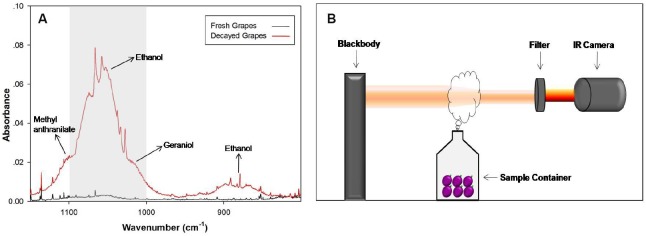
Fig 1. Schematic diagram of the experimental set-up and the wavelength band chosen for the filter.
(A) Infrared feature spectra of alcohols released from decayed grapes, as recorded in our previous study. The marked area shows the wavelength band chosen in this study (redrawn from Dong et al. [10]). (B) Non-dimensional diagram of the experimental set-up.

