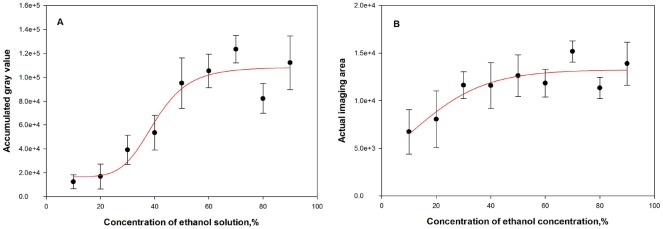
Fig 4. Averaged AGV and AIA of vapor images of volatiles released from ethanol solutions of different concentrations.
The accumulated gray value (A) and actual imaging area (B) obtained from the images of gas plumes prior to being overlaid on the corresponding cap-on images when ethanol solution concentration ranged from 90% to 10% (error bars represent the standard errors, similarly hereinafter).

