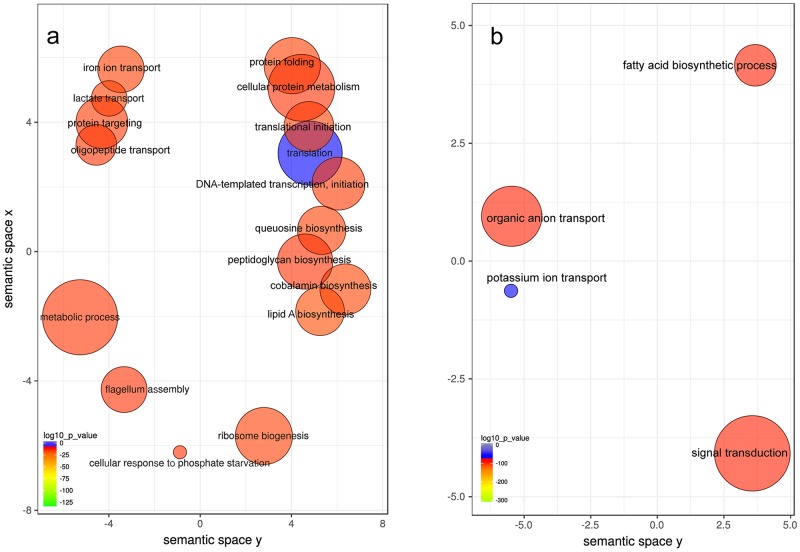
Fig 2. GO enrichment analysis comparing plaque response to the presence and absence of added ion potassium to the medium.
Enriched terms obtained using GOseq were summarized and visualized as a scatter plot using REVIGO. Only GO terms with FDR adjusted p-value < 0.05 in the 'GOseq' analysis were used. A) Summarized GO terms related to biological processes after addition of K+. B) Summarized GO terms related to biological processes with no K+ added. Circle size is proportional to the frequency of the GO terms, color indicates the log10 p-value (red higher, blue lower). Distance between circles represent GO terms' semantic similarities. Each of the circles represent a GO term, which depending on the similarity in the terms included in them they will be closer or more distant in the graph.

