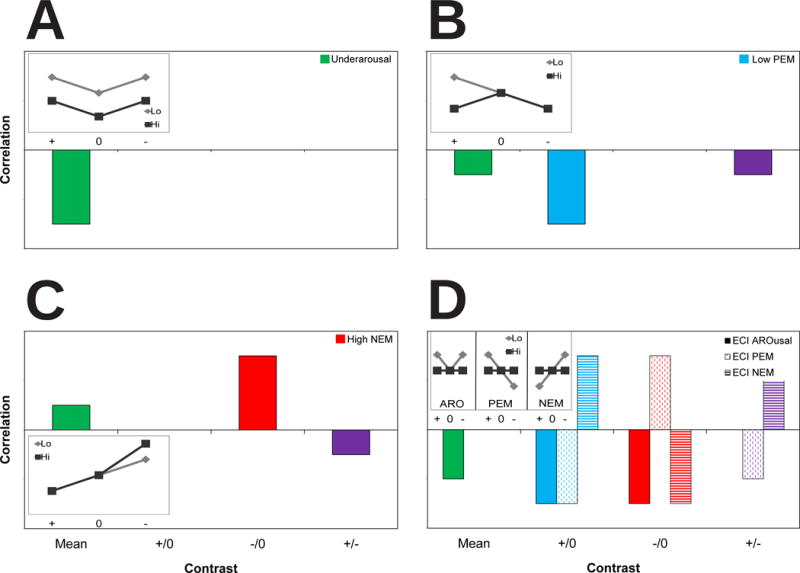
Figure 1.

Schematic representation of patterns of results predicted from various models of emotional dysfunction in depression. Each panel represents the pattern of correlations between depressive symptomatology and various emotional contrasts that would support the model depicted. Panel A represents the underarousal model of depression, panel B the low positive emotion (PEM) model, panel C the high negative emotion (NEM) model, and panel D the emotion context insensitivity (ECI) model. Mean = overall mean magnitude (green), +/0 = pleasant minus neutral (blue), −/0 = aversive minus neutral (red), +/− = pleasant minus aversive (purple). To clarify these expected results, each inset diagram depicts the patterns of emotional modulation predicted for depressed (Hi) versus nondepressed (Lo) participants in each model of emotional dysfunction with arbitrary y axis units. + = pleasant, 0 = neutral, − = aversive.
