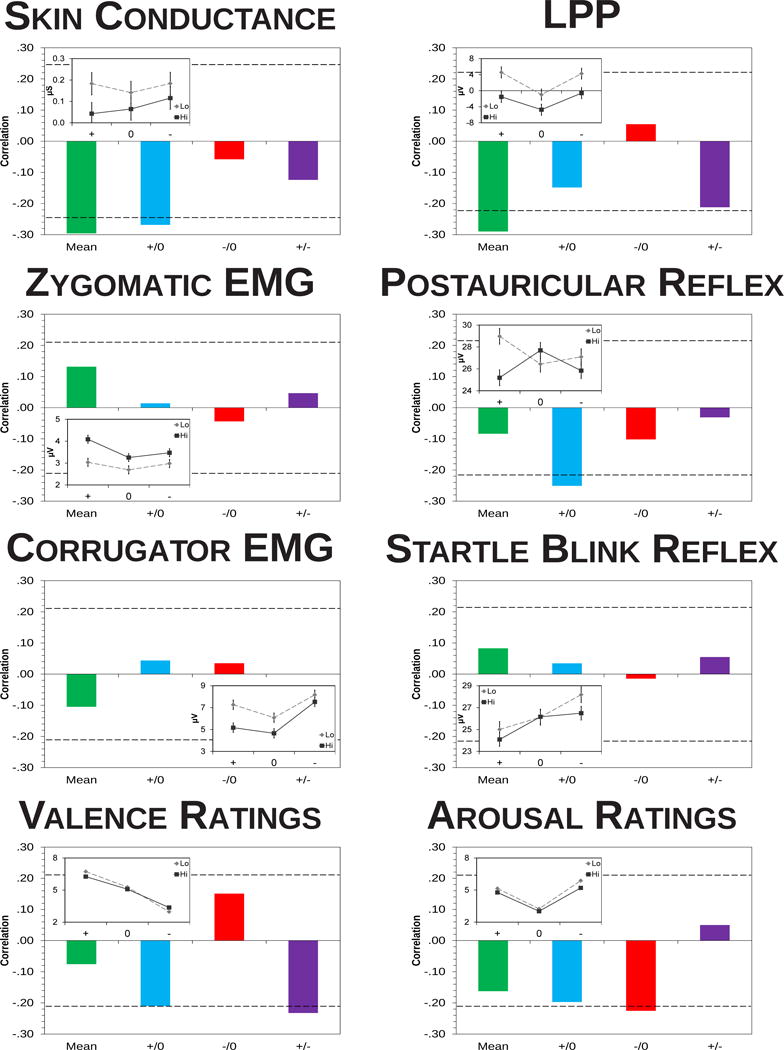
Figure 3.

Correlations of total depressive symptomatology with the mean and emotional modulation of each measure. The patterns of correlations in each panel may be compared with those depicted in Figure 1 to ascertain which models of emotional dysfunction in depression are supported for a given measure. Correlations outside the dashed lines are significant at an α level of .05. Mean = overall mean magnitude (green), +/0 = pleasant minus neutral (blue), −/0 = aversive minus neutral (red), +/− = pleasant minus aversive (purple). n = 65 for skin conductance response, n = 79 for LPP amplitude, n = 83 for postauricular and startle blink reflexes, n = 87 for zygomatic and corrugator EMGs and for pleasantness and arousal ratings. Given the α level of .05, there were more significant correlations than would be expected by chance alone, binomial test p = .005. To clarify these results, each inset diagram displays the patterns of emotional reactivity for participants 1 SD above the mean in depressive symptoms (Hi) compared to all other participants (Lo). Error bars represent the error term of the Valence × Group interaction.
