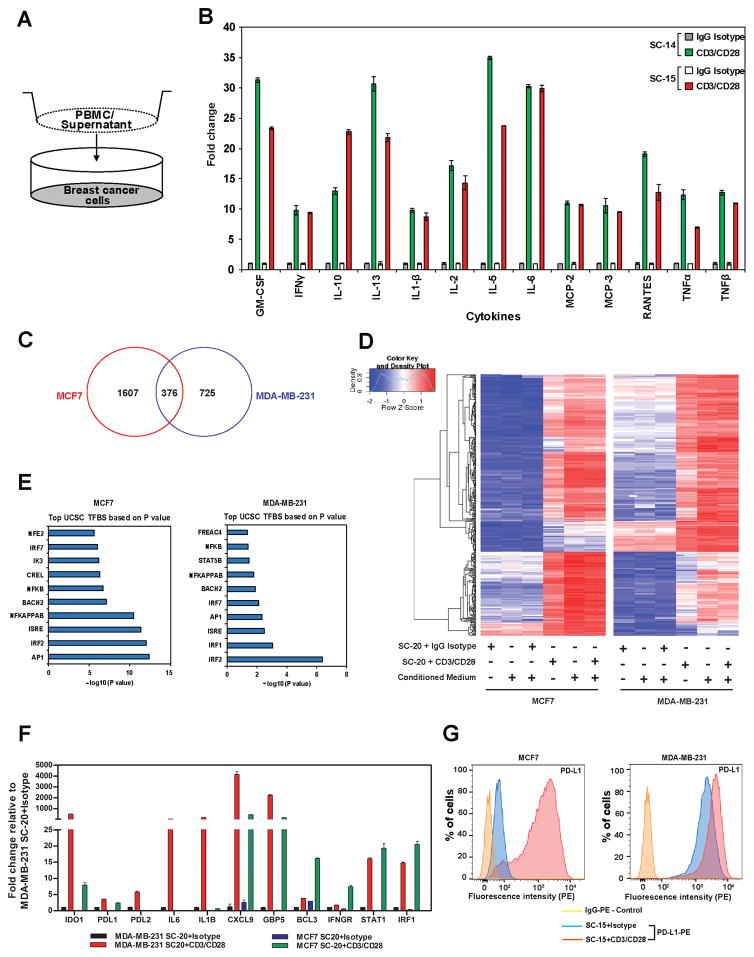
Figure 1.
Coculture of activated human T cells induced immune response gene signature in BC cells.
A, Schematic representation of coculture experiment. B, Cytokines secreted by PBMCs that were activated with anti-CD3/CD28 antibodies. PBMCs from two donors (SC-14, SC-15) were analyzed using cytokine array. C, Venn diagram showing the number of genes upregulated in MCF7 and MDA-MB-231 cells when cocultured with activated PBMCs. D, Heat map resulted from a hierarchical cluster analysis of 376 genes upregulated in both MDA-MB-231 and MCF7 cells after they were cocultured with PBMCs. E, List of top transcription factor binding sites enriched in the promoter of upregulated genes after cocultured with PBMCs in MCF7 and MDA-MB-231, respectively. F, Validation of RNAseq results by qRT-PCR. G, PD-L1 cell surface expression measured by flow cytometry after being cocultured with control or anti-CD3/CD28 activated PBMCs (SC-15). Data shown in B, F, and G are from representative experiments using at least 2 independent donor PBMC samples. The RNA-seq experiment in C was carried out using a single donor PBMC sample, but under three different experimental settings as described in the Materials and Methods.

