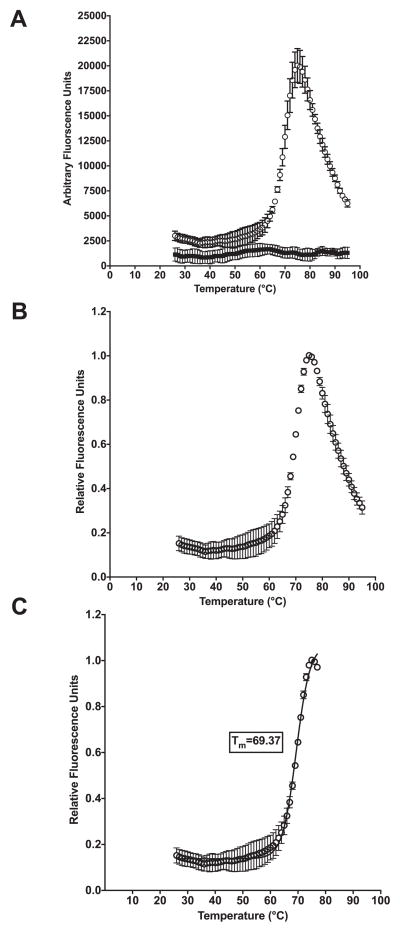
Fig. 2.
Representative data analysis with lysozyme. (A) Arbitrary fluorescence units for 6 well run with Lysozyme (empty circles) and buffer control incubated with SYPRO Orange (filled squares) obtained from ABI real-Fast PCR instrument plotted against temperature. (B) Data shown as relative fluorescence units plotted against temperature. (C) Relative fluorescence data truncated and fit with the Boltzmann equation to determine melting temperature (Tm).

