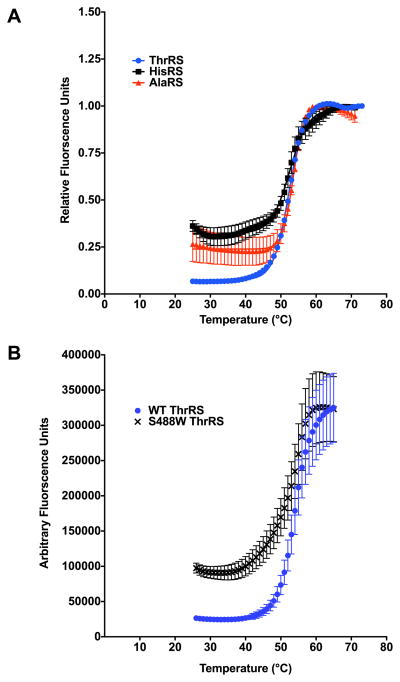
Fig. 3.
Protein melting curves for representative bacterial Class II aminoacyl-tRNA synthetases. (A) WT ThrRS (blue circles), HisRS (black diamond) and AlaRS (red squares) in the absence of substrates. (B) WT ThrRS (blue circles) and active site substitution S488W (black x). (For interpretation of the references to colour in this figure legend, the reader is referred to the web version of this article.)

