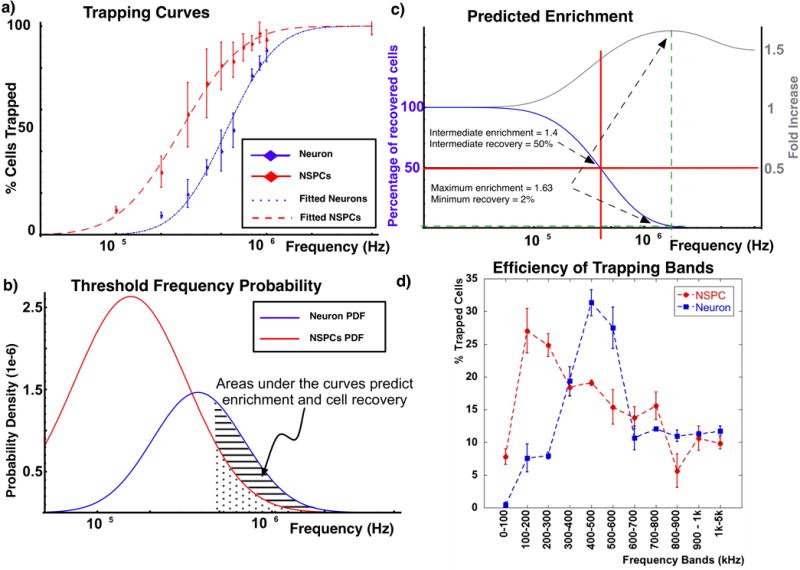
Fig. 7.

a) Trapping curves of neurons and NSPCs increase with the applied frequency, reaching maximum values at frequencies above 1 MHz. Both TCs can be fitted to a log-normal distribution. b) The probability density function (PDF) of the threshold frequency can be derived from the fitted trapping curves. c) Integrating under the areas of both PDFs it is possible to estimate the number of cells collected and the resulting enrichment. d) Trapping neurons and NSPCs at discrete frequency bands shows that there is an optimal frequency band where the number of captured cells is maximized, in this case the 100–200kHz band. Neurons however show a maximum for the frequency band of 400–500kHz.
