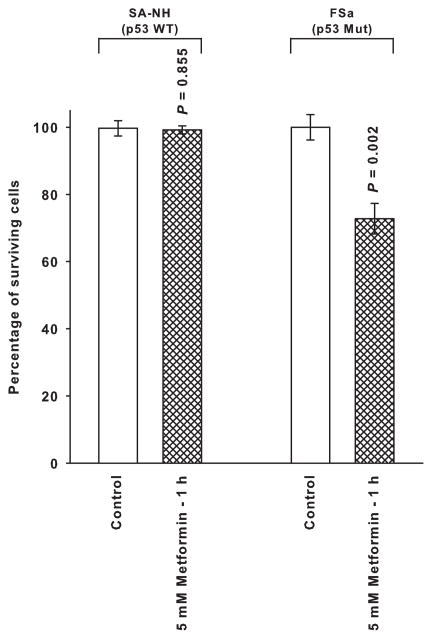
Figure 1.
The toxicity profile for metformin in p53 wild type (WT) SA-NH murine sarcoma and p53 mutant (Mut) FSa fibrosarcoma cells exposed to a 5 mM concentration for 1 h. Each experiment was performed three times and error bars represent the standard error of the mean (SEM). P values comparing the survival of metformin treated cells with those of their corresponding untreated controls are presented for comparison.

