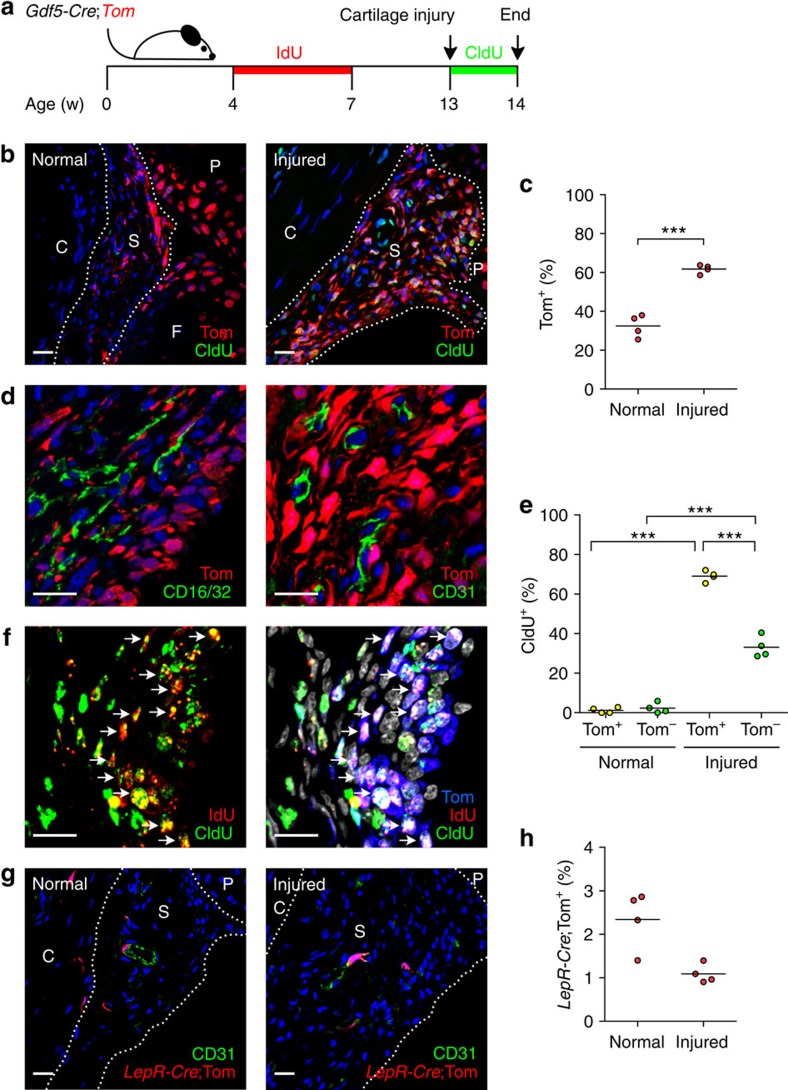
Figure 2. Contribution of Gdf5 lineage to synovial hyperplasia after cartilage injury.
(a) Schematic experimental design for data in b–f. (b) IF staining for Tom (red) and CldU (green) in control and injured knee synovium. Nuclei were counterstained with DAPI (blue). (c) Tom+ cells, as percentage of total cells in synovium as shown in b, increased after injury (***P<0.0001; n=4; Student's t-test). (d) Tom+ (red) cells in injured knee synovium negative for the haematopoietic marker CD16/CD32 (green; n=3; image on left) and endothelial marker CD31 (green; n=4; image on right). Nuclei were counterstained with DAPI (blue). (e) CldU-labelling showing higher rate of proliferation in Tom+ compared to Tom− cells after injury (***P<0.0001; n=4; two-way ANOVA with Bonferroni post-test). (f) IF staining for IdU (red), CldU (green) and Tom (blue) in injured knee synovium (n=3). Nuclei were counterstained with DAPI (grey). Left: IdU and CldU overlaid; right: all channels overlaid. Arrows indicate triple-labelled cells. (g) Tom+ (red) cells in control and injured knee synovium of adult LepR-Cre;Tom mice (n=4) with CD31 in green. Nuclei were counterstained with DAPI (blue). (h) Tom+ cells in synovium as percentage of total cells. Dashed lines, synovial boundary; S, synovium; P, patella; F, femur; C, capsule. Scale bars, 20 μm. Data in b,c,e are representative of two experiments.

