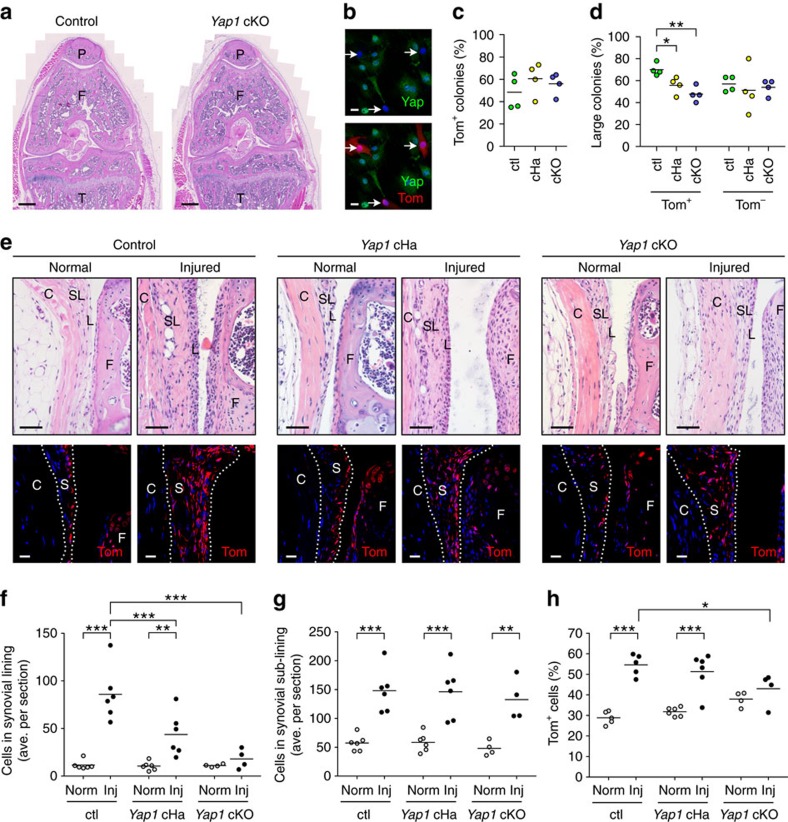
Figure 5. Conditional knockout of Yap1 in Gdf5-lineage cells prevents synovial lining hyperplasia after cartilage injury.
(a) H&E-stained sections of knees from an adult Gdf5-Cre;Yap1fl/fl;Tom (Yap1 cKO) mouse and littermate control. P, patella; F, femur; T, tibia. Scale bars, 500 μm. (b) Lack of Yap (green) expression by Tom+ (red) synovial cells from adult Yap1 cKO mice (arrows) indicating successful Cre-mediated Yap1 KO in Gdf5-lineage cells (n=3). Nuclei were counterstained with DAPI (blue). Scale bars, 20 μm. (c,d) CFU-f activity of synovial cells isolated from control (ctl), Yap1 haploinsufficient Gdf5-Cre;Yap1fl/WT;Tom (Yap1 cHa) and Yap1 cKO mice showing (c) percentage of colonies (≥8 cells, that is, ≥3 population doublings) that were Tom+, and (d) percentage of Tom+ colonies that were large (≥64 cells, that is, ≥6 population doublings) in ctl, Yap1 cHa and Yap1 cKO cultures (*P<0.05; **P<0.01; n=4; one-way ANOVA with Bonferroni post-test). (e) Normal and injured knee synovium of ctl, Yap1 cHa and Yap1 cKO mice 6 days after cartilage injury. Top: H&E-stained sections. Bottom: Tom-stained (red) sections with DAPI (blue) counterstain. S, synovium; L, synovial lining; SL, synovial sub-lining; C, capsule; F, femur. Scale bars, 50 μm (H&E images) and 20 μm (fluorescent images). (f,g) Average number of cells per section in the synovial lining (f), and sub-lining (g), quantified from H&E images as in e, showing decreased cellularity in synovial lining but not sub-lining of injured cHa and cKO mice compared to ctl mice (**P<0.01; ***P<0.001; n=4–6; two-way ANOVA with Bonferroni post-test). (h) Yap1 cKO mice showed diminished expansion of Tom+ Gdf5-lineage cells in synovium after cartilage injury (*P<0.05; ***P<0.001; n=4–6; two-way ANOVA with Bonferroni post-test).

