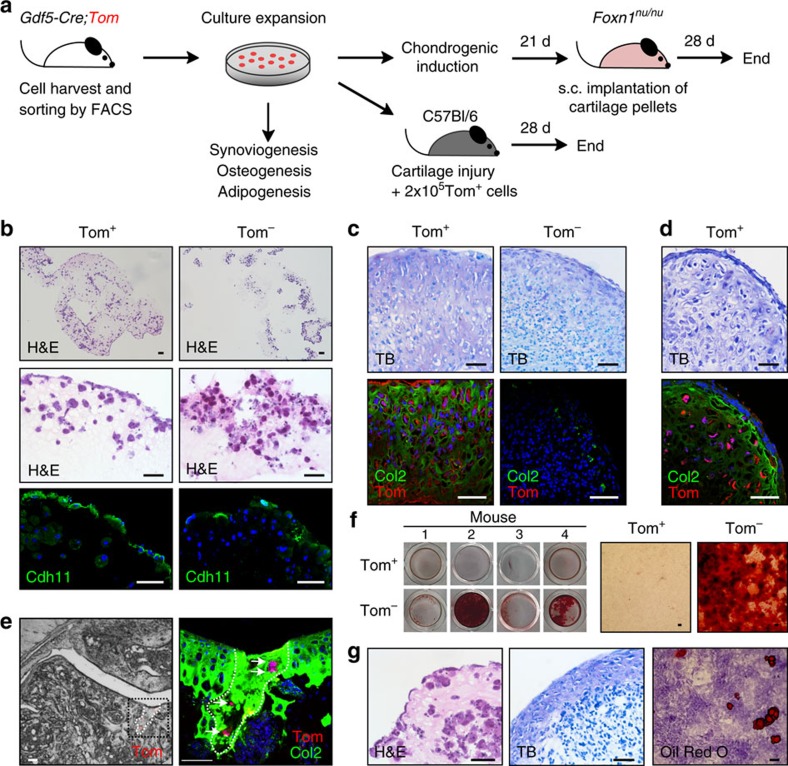
Figure 7. Cell patterning and differentiation capacity of culture-expanded Gdf5-lineage cells.
(a) Schematic experimental overview. (b) Tom+ cells (n=4 donor mice), but not Tom− cells (n=3 donor mice), formed a synovial-like structure with elongated, flattened cells at the matrix-media interface staining for Cdh11. Top and middle: H&E-stained sections; bottom: IF staining for Cdh11 (green) with DAPI counterstain (blue). (c,d) Cartilage pellets of (c) Tom+ and Tom− cells after in vitro chondrogenic induction (six pellets of cells from three donor mice) and (d) Tom+ cells after explant from nude mice (seven pellets of cells from three donor mice; pooled data from two experiments). Top: TB staining. Bottom: Col2 (green) and Tom (red) IF, with DAPI counterstain in blue. Tom+ cells gave rise to a matrix that stained for TB and Col2, resistant to in vivo remodelling. (e) Contribution of transplanted Tom+ cells to cartilage repair in non-healer C57Bl/6 mice (n=11). Left: Cryosection showing Tom+ (red) cells at the cartilage defect. Right: Higher magnification of black-boxed area on left after immunostaining for Col2 (green) with DAPI counterstain (blue). Shown is an overlay of two confocal images at different z positions. Dashed line, outline of injury. (f) Tom+ cells (n=4 donor mice) failed to show osteogenesis by Alizarin Red S staining; microscopy images shown on right. Data are from four experiments. (g) Single-Tom+-cell-derived clonal population showing tripotency to FLS (left), chondrocytes (middle) and adipocytes (right). Three clonal cell populations were analysed. Scale bars, 50 μm.

