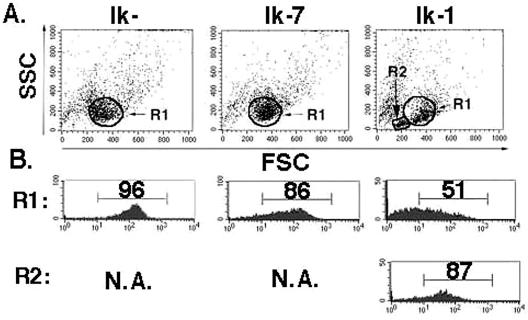
FIG. 3.
Appearance of a small cell population in Ik-1-expressing JE131 cells. At 48 h after infection, JE131 cells infected with the MSCV-IRES-H-2Kk (Ik−), MSCV-(Ik-7)-IRES-H-2Kk (Ik-7), or MSCV-(Ik-1)-IRES-H-2Kk (Ik-1) retrovirus were stained with fluorochrome-conjugated anti-H-2Kk, and flow cytometric analysis was performed. (A) A unique population of cells with low forward and side scatter (R2) are observed in the Ik-1-transduced culture. (B) This effect is confined to successfully transduced cells, since the small cell population is almost uniformly H-2Kk+ and, therefore, Ik-1+. The larger cell population (R1) is already beginning to lose H-2Kk and, therefore, Ik-1 expression. This figure was generated by using CellQuest and Adobe Photoshop software. FSC, forward scatter; SSC, side scatter.

