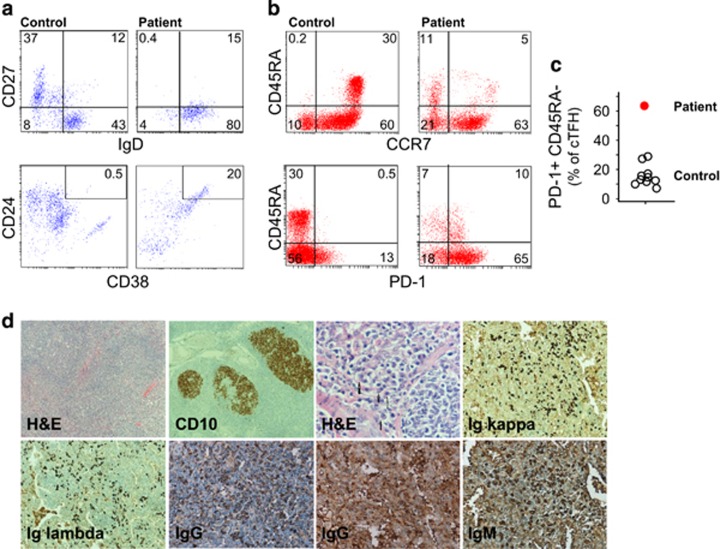
Figure 3.
T- and B-cell phenotypes and tissue plasma cell infiltrate. (a) Flow cytometry analysis of B-cell subsets; naive (CD19+CD27−) and memory (CD19+CD27+) B cells, CD21low CD19+ B cells in peripheral blood mononuclear cells (PBMCs) from patient and a healthy control. (b) CD4+ T-cell subsets (naive, CCR7+CD45RA+; TCM, CCR7+CD45RA−; TEM, CCR7−CD45RA−; TEMRA, CCR7−CD45RA+) and cTFH (CD45RA−PD-1+) from patient and a healthy control. (c) Summary for the cTFH obtained for the proband and normal controls (n=10). (d) Biopsies from lymph node with follicular hyperplasia showing reactive secondary follicles (H&E, 50 ×). Lymph node immunohistochemistry showing established germinal centres, CD10 immunoperoxidase (50 ×), and kappa and lambda light chain and immunoglobulin isotype expression.

