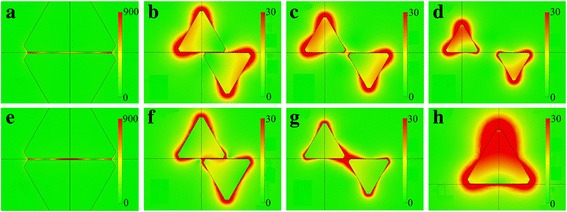
Fig. 3.

Calculated electric field distributions of Ag TNP dimers and monomer. Images are taken as the cross-section of the Ag TNP dimer at z = 0 on the x-y plane. Panels a–g correspond to the points A–G marked in Fig. 2a. Peak 1: a R = 0; b R = 0.5, B; c R = 1; d R = 1.5. Peak 2: e R =0, f R = 0.5, g R = 1. h Monomer
