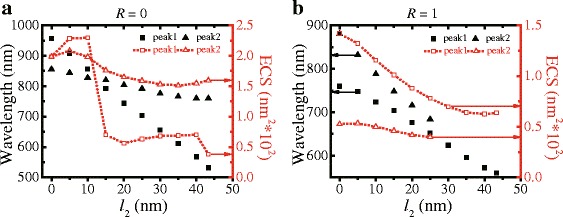
Fig. 4.

ECS spectra of Ag TNP dimers with l 2 changing from 0 to 43.3 nm. a R = 0; b R = 1. The dark scatter and red short dot lines show the resonant wavelength and intensity spectra, respectively. The square and triangle lines show peak 1 and peak 2, respectively
