Fig. 5.

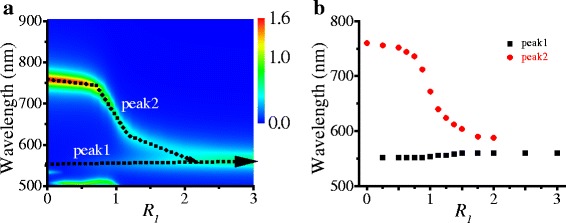
ECS spectra of the Ag HNP dimer. a ECS intensity distribution map versus R 1 and wavelength. b Resonant wavelength spectra of the two peaks

ECS spectra of the Ag HNP dimer. a ECS intensity distribution map versus R 1 and wavelength. b Resonant wavelength spectra of the two peaks