
Fig. 9.
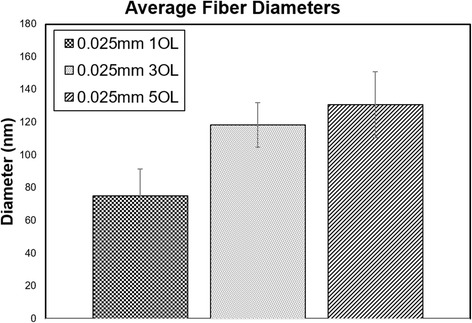
Average fiber diameters calculated from SEM images at one, three, and five overlaps (OL)
Official websites use .gov
A
.gov website belongs to an official
government organization in the United States.
Secure .gov websites use HTTPS
A lock (
) or https:// means you've safely
connected to the .gov website. Share sensitive
information only on official, secure websites.
Average fiber diameters calculated from SEM images at one, three, and five overlaps (OL)