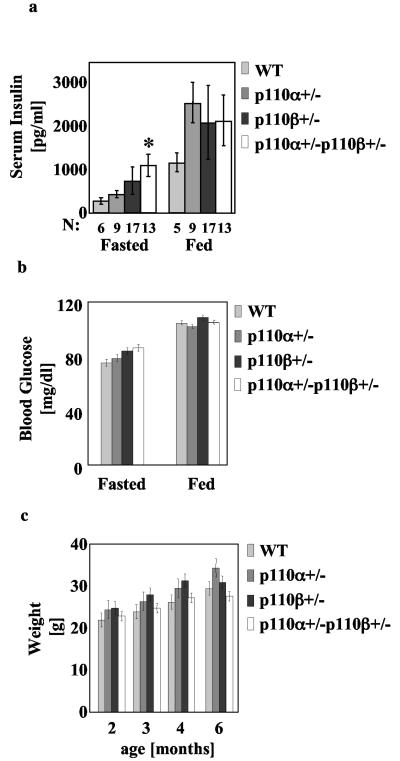
FIG. 2.
Mild hyperinsulinemia in p110α+/− p110β+/− mice. (a) Plasma insulin concentrations in 6-month-old fasting and fed male mice. Results are means ± standard deviations of the means. *, P < 0.05, compared to wild type (WT). (b) Weights for male mice with the indicated genotypes at different ages. The data express the means ± standard deviations of the means (WT, n = 6; p110α+/−, n = 8; p110β+/−, n = 15; p110α+/− p110β+/−, n = 12). P values were calculated by using the Student t test. There was no statistically significant difference between genotypes. (c) Blood glucose levels of 6-month-old male fasting or fed mice with the indicated genotypes. The data express the means ± standard deviations of the means (WT, n = 6; p110α+/−, n = 8; p110β+/−, n = 15; p110α+/− p110β+/−, n = 12). P values were calculated by using the Student t test. There was no statistically significant difference between genotypes.

