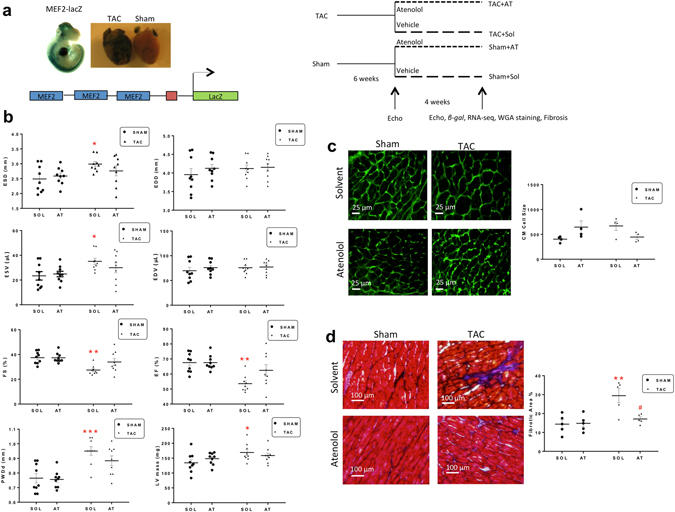
Figure 1.

Atenolol reverses heart failure symptoms in TAC mice. (a) Experimental design overview. MEF2-LacZ mice (6–8 weeks old) underwent transverse aortic constriction (TAC) or Sham surgeries, followed by Solvent or Atenolol (50 mg/kg/day) treatment (n = 9). (b) Functional analysis of TAC or Sham mouse hearts after four weeks of Atenolol or Solvent treatment. End systolic diameter (ESD), end diastolic diameter (EDD), ejection fraction (EF), fractional shortening (FS), end systolic volume (ESV), end diastolic volume (EDV), left ventricular mass (LV), and left ventricular posterior wall depth (PWDd) were assessed by ultrasound echocardiography. (n = 9), Data are presented as mean ± SEM. *P < 0.05 **P < 0.01 ***P < 0.001 vs Sham + Sol. (c) WGA stain depicting cardiac hypertrophy. Images are representative of an average of n ≥ 10 images per heart, 4 animals per group. Scale bar: 25 µm. Graph below shows cardiomyocyte size (CM cell size), quantified based on an average of ≥10 cell measurements per mouse (n = 4). (d) Masson’s Trichrome stain depicting fibrosis. Images are representative of n = 10 images per heart, 5 animals per group. Cardiomyocytes appear red, nuclei appear black and collagen appears blue. Scale bar: 100 µm. Graph shows quantified cardiomyocyte fibrosis based on a three representative images per mouse (n = 5). Data are presented as mean ± SEM. **P < 0.01 vs Sham + Sol. #P < 0.05 vs TAC + Sol.
