
Figure 2.
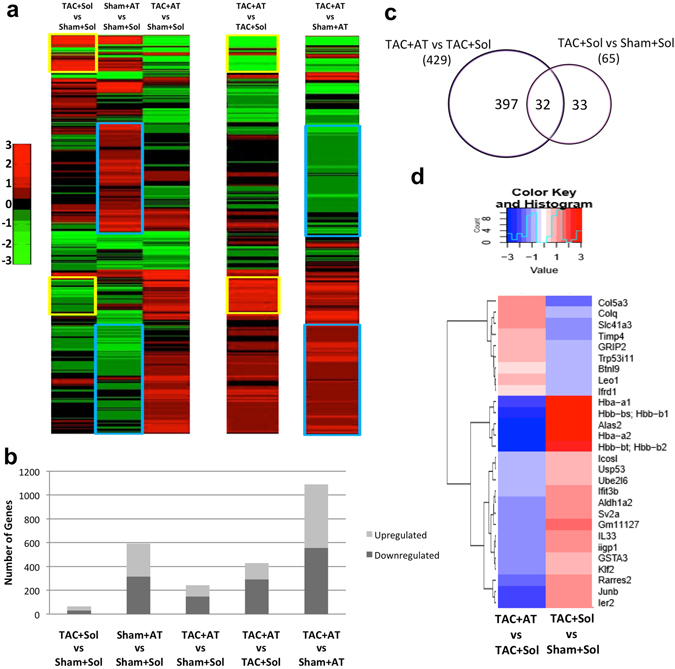
Changes in gene expression caused by aortic constriction is reversed by atenolol treatment. Four weeks after Atenolol treatment of TAC or Sham operated mice, RNA-seq analysis of whole tissue from the left ventricle was performed. Similar tissue was collected the Solvent control group (n = 3 per group). (a) A heatmap depicting changes in gene expression of 1571 protein coding genes. Genes are ordered based on hierarchical clustering. Genes up- or down-regulated by TAC alone, relative to control (leftmost column; yellow box). Effects of β-blocker (2nd leftmost column; blue box). (b) The total number of up and downregulated genes in each condition. (c) A select group of genes (32) were differentially regulated in both the TAC + Sol vs Sham + Sol and TAC + AT vs TAC + Sol conditions. (d) A heatmap depicting the Fold Change values of TAC + AT vs TAC + Sham and TAC + Sol vs Sham + Sol.