
Figure 4.
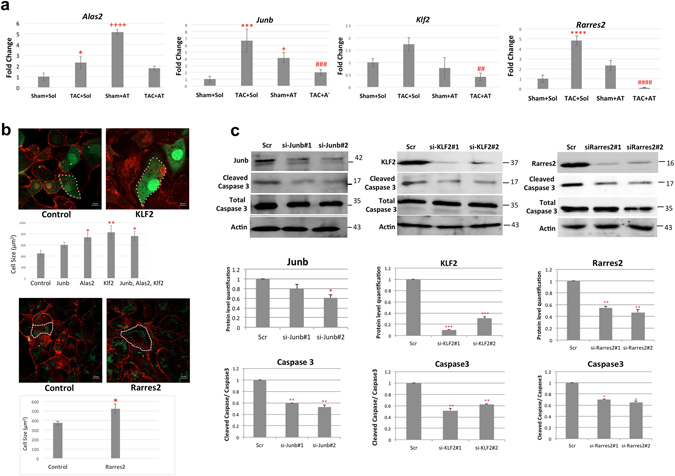
Role of Klf2, Junb, Rarres2 and Alas2 in cardiomyocyte hypertrophy and apoptosis. (a) Modulation of Klf2, Junb, Rarres2 and Alas2 expression in response to TAC and Atenolol as depicted in Fig. 2c, was confirmed using RT-qPCR. cDNA was analyzed via RT-qPCR using SYBR Green master mix. Data were normalized to Gapdh and are presented as fold change using the delta delta Ct method (n = 3, *P < 0.05 ***P < 0.001 ****P < 0.0001 Sham + Sol vs TAC + Sol, +P < 0.05 ++++P < 0.0001 Sham + Sol vs Sham + AT, ##P < 0.01 ###P < 0.001 ####P < 0.0001 TAC + Sol vs TAC + AT). (b) WGA staining depicts cardiac hypertrophy. Cardiac HL-1 cells (upper panel) were transfected with GFP and Alas2, Junb, or Klf2 expression plasmids individually or in a mixture and stained with Wheat Germ Agglutinin (WGA) in red. The bar graph indicates that cell size of GFP positive HL-1 cells, quantified based on 5 cell measurements per image. Data are presented, as mean ± SEM. *P < 0.05 **P < 0.01 vs control. Scale bar is 10 μm. Cardiac HL1 cells (bottom panel) were transfected with GFP and Rarres2 expression plasmids and stained with WGA in Red. The bar graph indicates cell size of GFP positive HL-1 cells, quantified based on 10 cell measurements per image. Data are presented, as mean ± SEM. *P < 0.05 vs control. Scale bar is 10 μm. (c) Primary cardiomyocytes were transfected with two independent siRNAs targeting Junb, Rarres2 or Klf2 and then treated with isoproterenol (10 μM) for 48 hours. A scrambled siRNA was used as a control (Scr). The expression of cleaved Caspase 3 was assessed to determine changes in cardiomyocyte apoptosis using western blot analysis. A bar graph below each western blot represents the level of Cleaved Caspase 3 protein expression after normalized to total Caspase 3 (bottom panel). Data are presented as mean ± SEM. n = 3 *P < 0.05 **P < 0.01 ***P < 0.001 vs control. The western blots are cropped. An odyssey quantitative blotting system is used for the western blot analysis, therefore the quantitation is linear.