Figure 5.

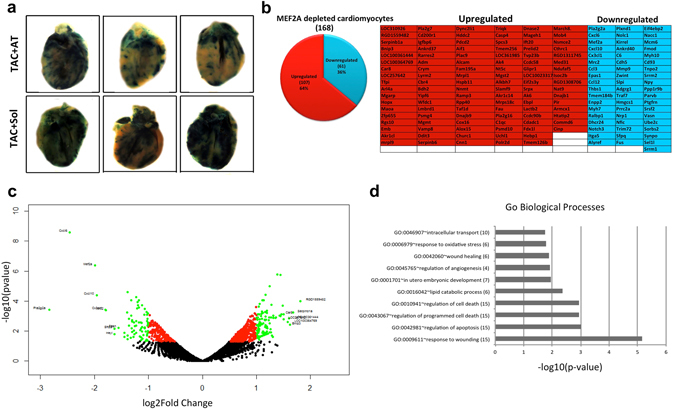
Involvement of MEF2 in cardiac hypertrophy and death. (a) Whole heart LacZ staining of MEF2-LacZ mice after TAC + Sol or TAC + AT treatment (n = 3). (b) The number of up or downregulated genes in response to MEF2A knockdown in primary cardiomyocytes. A table of genes identified by RNA-seq analysis after MEF2A knockdown (upregulated genes are in red; downregulated genes are in blue). (c) A volcano plot depicting up and downregulated genes identified in RNA-seq in response to MEF2A knockdown in primary cardiomyocytes. Black if p-value > 0.05, red if p-value < 0.05, green if log2FoldChange >1 or <−1 and p-value < 0.05. Labels are present only on logFC > ± 1.5. (e) GO Biological Processes associated with MEF2A knockdown in primary cardiomyocytes. The number of genes is in parentheses beside each term.
