
Figure 3.
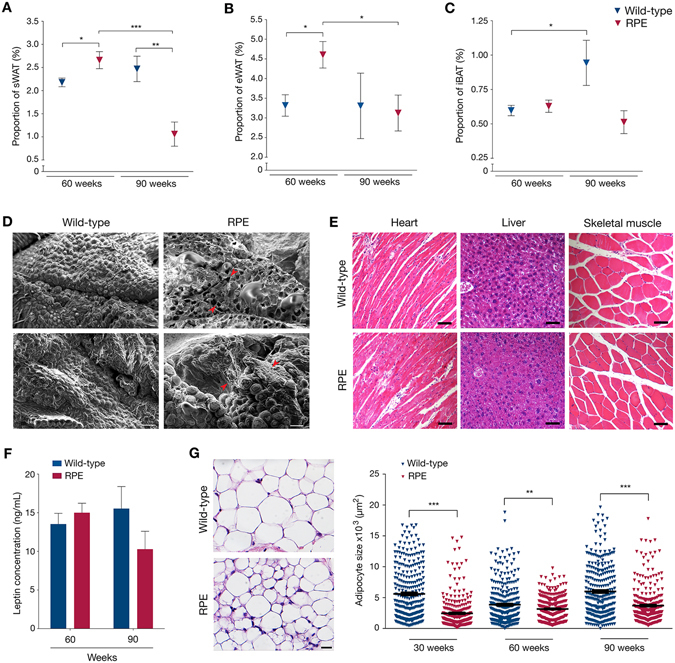
Loss of adipose depots with aging and phenotypic observations. (A–C) Weights of sWAT (A), eWAT (B) and iBAT (C) depots normalized to body weights of wild-type and RPE animals. (D) Representative SEM micrographs of 90-week wild-type and RPE mice, exhibiting adipocyte loss and tissue fibrosis. Red arrows indicate sites of anomaly. (E) Histological staining of heart, liver and skeletal muscle showing no accumulation of lipid droplets in either control or RPE mice. (F) Graph representing the concentration of circulating leptin at both 60 and 90 weeks of age in either wild-type or RPE mice, as assessed by ELISA. (G) Example of HTX staining from 30-week-old wild-type and RPE sWAT, used to estimate average adipocyte surface area (left). Graph representing the adipocyte area of all counted cells in sWAT of 30-, 60- and 90-week old animals (right). Scale bars: D = 100 μm, E = 5000 μm, F = 100 μm. Data are represented as mean ± SEM.