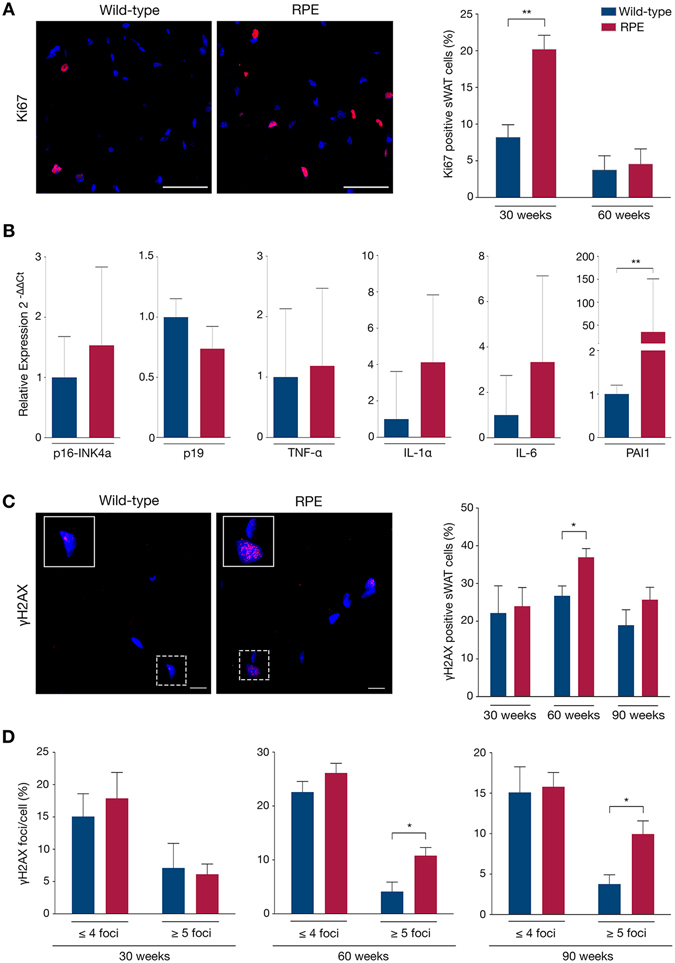
Figure 4.

sWAT characterization: Hyperproliferation, senescence and DNA damage. (A) Proliferation was determined by immunofluorescent staining of Ki67 (red) in cell nuclei (blue), subsequently analyzed as the percentage of positively stained cells in mutant and control sWAT. (B) Senescence was determined via quantitative RT-PCR of specific target genes. (C,D) γH2AX immunofluorescent staining showing DNA DSBs (red) in cell nuclei (blue) of wild-type and RPE sWAT, first analyzed for the frequency of positive cells (C) and then for the frequency of γH2AX foci per cell (D). Scale bars: A = 50 μm, C = 10 μm. Data are represented as mean ± SEM.
