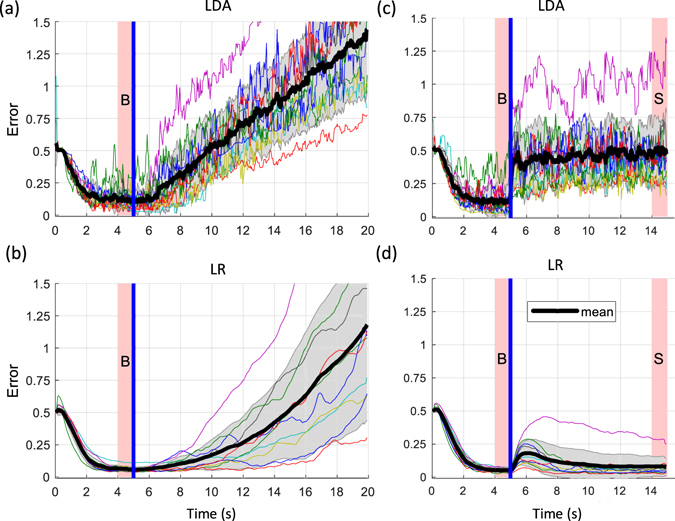
Figure 4.

Closed loop control performance (online). (a,b) Error in reaching when linearly increasing noise was added to the signals online for LDA (a) and LR (b). (c,d) Error in reaching when sudden noise was added to the signals online for LDA (c) and LR (d). The plots show the error for each subject and the mean and standard deviation across all subjects, for LDA (a) and LR (b). The plots show the error for each subject, the mean (black lines) and standard deviation (grey area is ±SD) across all subjects. The blue line indicates the beginning of the interval when the artificial noise was added and the pink shaded areas labelled with “B” and “S” mark the periods when the baseline error and the error with noise were extracted.
