
Figure 4.
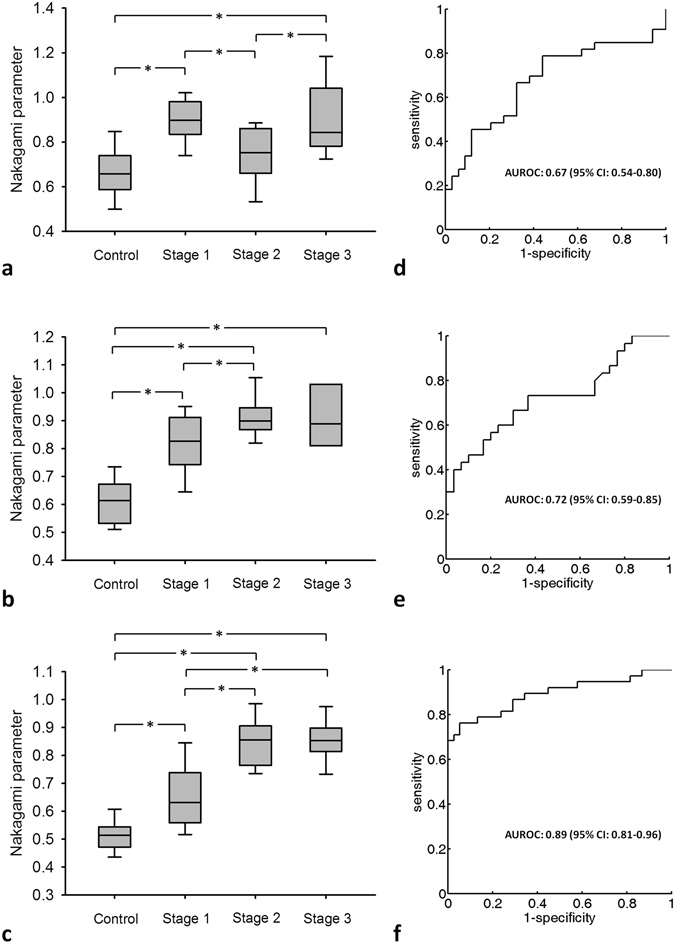
Nakagami parameters corresponding to different DMD stages. Data are expressed using box plots. The Nakagami parameter increases with the DMD stage, indicating that the backscattered statistics gradually change from a pre-Rayleigh distribution to a Rayleigh distribution. (a) Rectus femoris; (b) tibialis anterior; (c) gastrocnemius. (d–f) Corresponding ROC curves. The AUROC for the Nakagami parameter of the gastrocnemius muscle (0.89) is higher than those of the rectus femoris and tibialis anterior muscles.