
Figure 4.
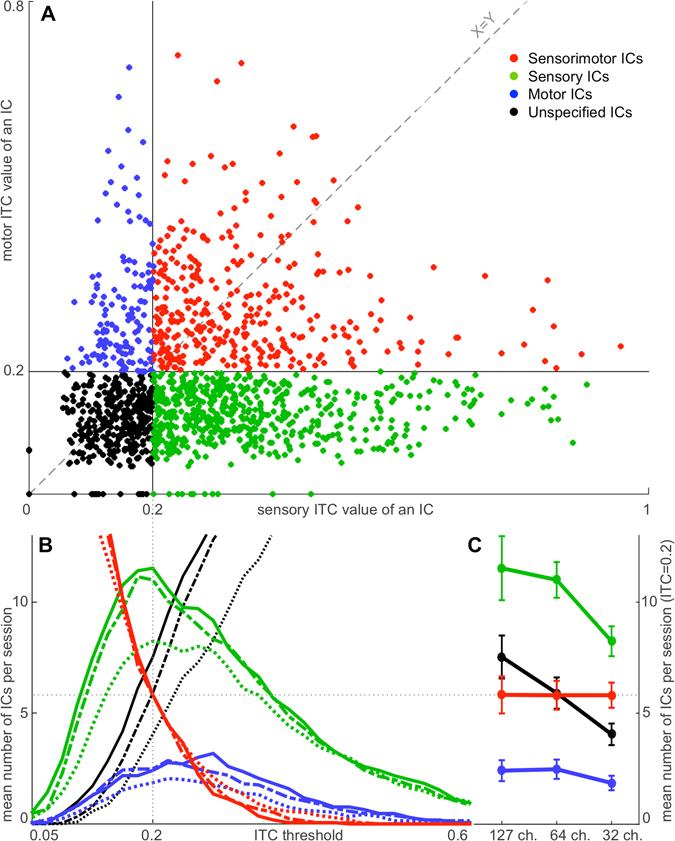
Distribution of ICs into the four groups: Motor, Sensory, Sensorimotor, and Unspecified. Panel (A) depicts 1412 accepted ICs in the study from 32-, 64- and 127-channel datasets. Each dot represents an IC with a Sensory ITC value as the X coordinate and a Motor ITC value as the Y coordinate. Blue dots represent Motor ICs. Green dots represent Sensory ICs. Red dots represent Sensorimotor ICs. Black dots represent Unspecified ICs. The vertical black line at X = 0.2 represents the sensory ITC threshold, and the horizontal black line at Y = 0.2 represents the motor ITC threshold to separate ICs into the four groups. The grey diagonal dashed line (X = Y) represents the ITC-threshold trajectory of the intersection of the threshold lines. The results of distribution of ICs into the four groups at different points of the trajectory are shown in Panel (B). The X-axis is derived from the X = Y dashed line in Panel (A). The Y-axis represents a mean number of ICs in a group per session at different points of the grey diagonal dashed ITC-threshold-trajectory line (X = Y) in Panel (A). The grey dotted line at X = 0.2 indicates the selected ITC threshold for Sensory and Motor ITC values in Panel (A). X-axis data points interval in the illustration is equal to 0.02. Red curves represent Sensorimotor ICs. Green curves represent Sensory ICs. Blue curves represent Motor ICs. Black curves represent Unspecified ICs. Dotted curves represent 32-channel datasets. Dashed curves represent 64-channel datasets. Solid curves represent 127-channel datasets. Panel (C) shows the projection of the intersection points of the 12 coloured lines in Panel (B) with the grey dotted line at X = 0.2. Y-axis and colour coding remain the same as in Panel (B). Error bars represent standard error of the mean.