
Figure 5.
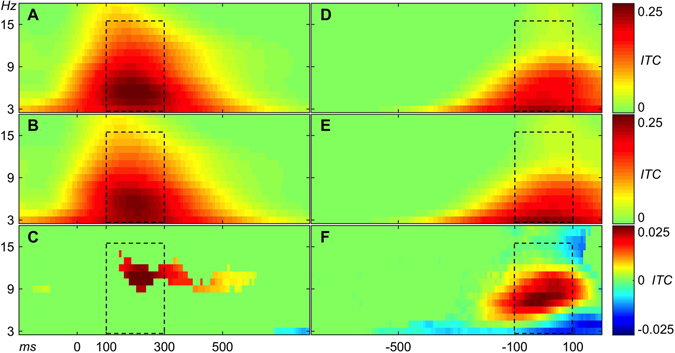
(A) Average ITC over 600 Sensory ICs. (B) Average ITC over 343 SensoriAverage ITC plots of Sensory, Motor, and Sensorimotor ICs. motor ICs. (C) Average ITC of Sensory ICs minus average ITC of Sensorimotor ICs. Note that colour-coding of subtraction is ten times amplified relative to panels A and B. 0 ms in plots (A,B, and C) indicate stimulus onset (D). Average ITC over 132 Motor ICs. (E) Average ITC over 343 Sensorimotor ICs. (F) Average ITC of Motor ICs minus average ITC of Sensorimotor ICs. Note that color-coding of subtraction is ten times amplified relative to panels D and E. 0 ms in plots (D,E, and F) indicate motor onset (button-press event). Panels C and F were masked according to two-sample t-test with p-value threshold < 0.01. The black dashed rectangles represent the same time-frequency windows of interest as in Fig. 3.