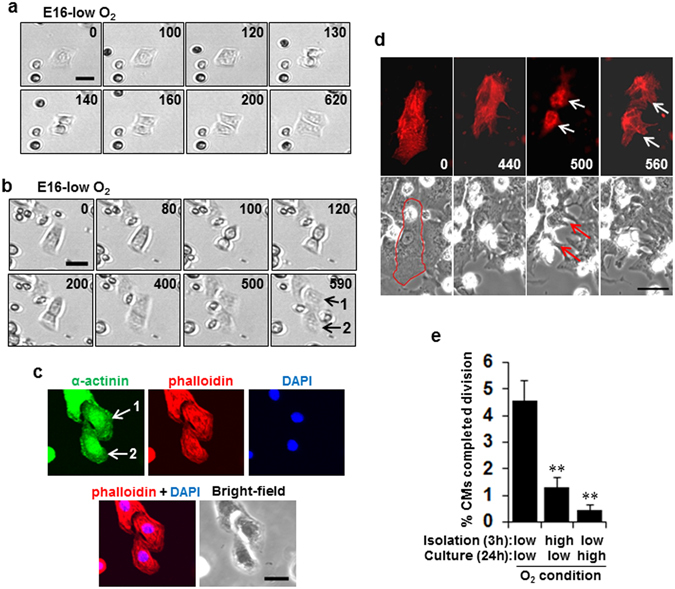
Figure 2.

Direct observation reveals O2-induced inhibition of fetal cardiomyocyte (fCM) cell division. (a,b) Two representative time-lapse recordings of cell division dynamics of E16 fCMs under low O2 isolation and culture conditions. The number on each panel indicates the time (in minutes) elapsed from the time indicated in the first panel. (c) Post-imaging sample of (b) containing two daughter cells following cell division (numbered as 1 and 2 on the last panel of (b)). The sample was fixed and immunostained for α-actinin and observed in phalloidin, DAPI, and bright-field images. Two identical daughter cells were then imaged (numbered as 1 and 2 in the upper left panel of (c)). This correlative analysis confirmed that the dividing cells were unequivocally CMs. (d) A representative time-lapse recording of cell division dynamics of fCMs transduced with sarcomeric α-actinin-mCherry baculovirus observed in bright-field images. The number on each panel indicates the time (in minutes) elapsed from the time indicated in the first panel. The event of mitosis and cytokinesis was marked by arrows. The contour of the fCM at time 0 was outlined in red. (e) Percentage of E16 fCMs that completed cell division as determined by time-lapse imaging under the indicated conditions. n = 3–6 independent experiments and ~1700 cells were counted for each condition. ** P < 0.01 compared to low O2 isolation and low O2 culturing conditions. Error bars = SEM. Scale bars = 30 µm in (a,b and d) and 20 µm in (c).
