
Figure 4.
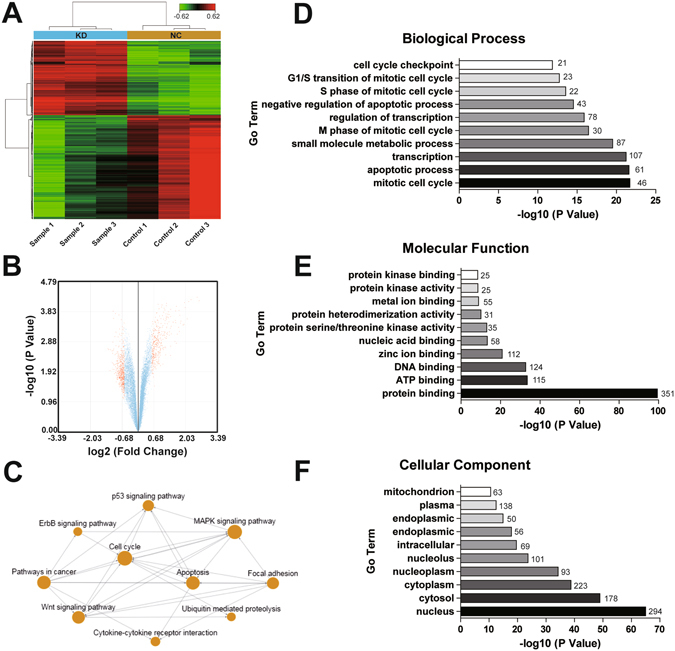
RAD51-AS1 knockdown regulates gene expression in SKOV3.ip cells. (A), Hierarchical clustering of the genes differentially expressed in SKOV3.ip cells 24 hours after RAD51-AS1 silencing. Each column represents one sample and each row represents one gene. The color scale at the top of the figure illustrates the relative expression of a gene across all of the samples, with red indicating high expression and green indicating low expression. (B), Volcano plot shows that some genes were differentially expressed after RAD51-AS1 knockdown. (C), Analysis of pathway relation network. The interactions in the KEGG Database were used to construct the interaction network between pathways, and the top ten pathways after silencing RAD51-AS1 are shown. (D,E and F), The significant analysis of Gene Ontology (GO) on three aspects (D, biological process analysis; E, molecular function analysis; F, cellular component analysis) were performed with parameter settings of P = 0.05, FDR = 0.05, and the top ten terms are listed.