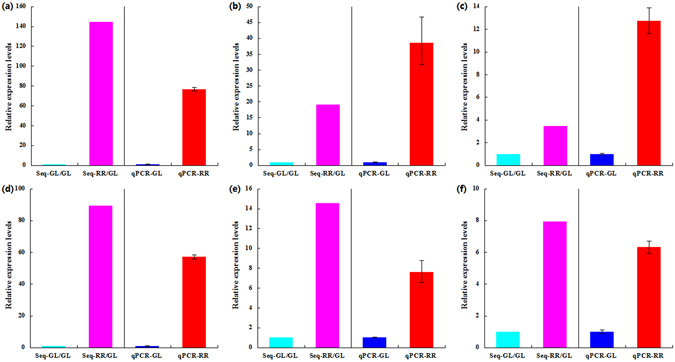
Figure 6.

The qRT-PCR verification of the G10H and 12OPR unigenes’ expression profiles between GL and RR lines in Lithospermum erythrorhizon (Le), Arnebia euchroma (Ae) and Echium plantagineum (Ep). (a) G10H-LeCL2572.Contig1, (b) G10H-AeCL6292.Contig2, (c) G10H-EpCL2694.Contig1, (d) 12OPR-LeCL2081.Contig2, (e) 12OPR-AeCL94.Contig3, (f) 12OPR-EpCL1162.Contig2; Seq. data from RNA-seq, qPCR. data from qRT-PCR; The error bars in the qPCR results represent standard deviation of three biological replicates.
