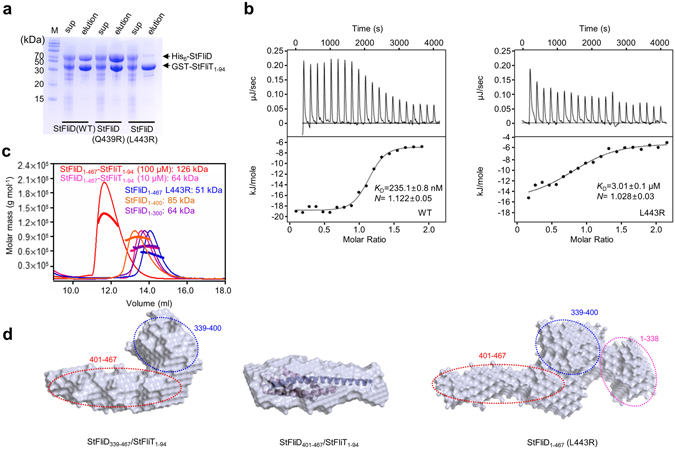
Figure 2.

Molecular interactions and SAXS solution structures of various StFliD-StFliT complexes. (a) Pull-down assay of his6-StFliD (WT, Q439R, and L443R) by GST-StFliT1–94. SDS-PAGE gels were visualized using Coomassie blue. (b) ITC of StFliT into StFliD solution. The StFliD WT and its mutant (L443R) were titrated against StFliT. (c) The StFliD1–467-StFliT1–94 complex (100 μM in red and 10 μM in pink) and StFliD1–467 L443R mutant (100 μM), StFliD1–300 (100 μM), and StFliD1–400 (100 μM) were analyzed by SEC-MALS. The thick line represents the measured MW. (d) SAXS solution structures of StFliD339–467-StFliT1–94 complex, StFliD401–467-StFliT1–94 complex, and StFliD1–467 L443R mutant. Reconstructed structural models were generated using the ab initio shape determination program DAMMIF. Surface renderings of the structural models were generated using PyMOL. To compare the overall shape and dimension of the StFliD401–467-StFliT1–94 complex, ribbon diagrams of the atomic models were superimposed onto reconstructed dummy atoms models using the program SUPCOMB. Dotted lines (pink, blue, and red) indicate the positions of each domain (residues 1–338, 339–400, and 401–467, respectively).
